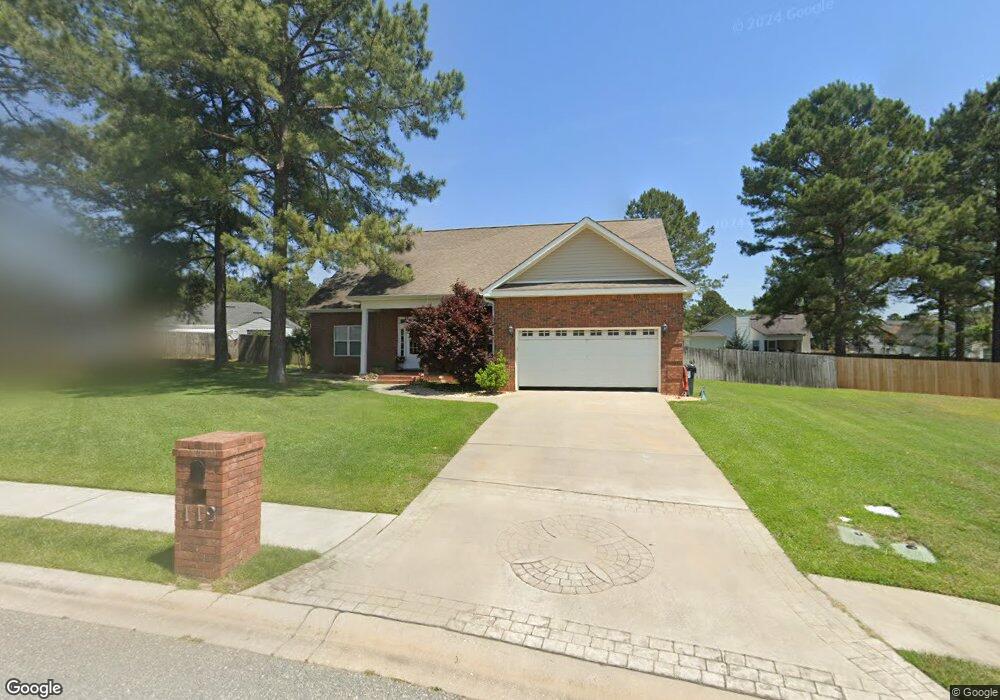
112 Galloway St Kathleen, GA 31047
Estimated Value: $261,000 - $293,000
3
Beds
2
Baths
1,958
Sq Ft
$142/Sq Ft
Est. Value
About This Home
This home is located at 112 Galloway St, Kathleen, GA 31047 and is currently estimated at $278,802, approximately $142 per square foot. 112 Galloway St is a home located in Houston County with nearby schools including Matthew Arthur Elementary School, Perry Middle School, and Veterans High School.
Ownership History
Date
Name
Owned For
Owner Type
Purchase Details
Closed on
Mar 26, 2010
Sold by
Wingate Land Llc
Bought by
Clelland James A
Current Estimated Value
Home Financials for this Owner
Home Financials are based on the most recent Mortgage that was taken out on this home.
Original Mortgage
$160,886
Outstanding Balance
$106,677
Interest Rate
4.91%
Mortgage Type
VA
Estimated Equity
$172,125
Purchase Details
Closed on
Jan 19, 2007
Sold by
Future Builders By M&L Llc
Bought by
Wingate Land Llc
Purchase Details
Closed on
Oct 2, 2006
Sold by
Custom Homes By Jeff Llc
Bought by
Future Builders By M & L Llc
Home Financials for this Owner
Home Financials are based on the most recent Mortgage that was taken out on this home.
Original Mortgage
$137,893
Interest Rate
6.36%
Mortgage Type
Purchase Money Mortgage
Purchase Details
Closed on
Aug 1, 2006
Sold by
Ironworks Llc
Bought by
Custom Homes By Jeff Llc
Create a Home Valuation Report for This Property
The Home Valuation Report is an in-depth analysis detailing your home's value as well as a comparison with similar homes in the area
Home Values in the Area
Average Home Value in this Area
Purchase History
| Date | Buyer | Sale Price | Title Company |
|---|---|---|---|
| Clelland James A | $157,500 | None Available | |
| Wingate Land Llc | -- | -- | |
| Future Builders By M & L Llc | $33,200 | None Available | |
| Custom Homes By Jeff Llc | $31,500 | -- |
Source: Public Records
Mortgage History
| Date | Status | Borrower | Loan Amount |
|---|---|---|---|
| Open | Clelland James A | $160,886 | |
| Previous Owner | Future Builders By M & L Llc | $137,893 |
Source: Public Records
Tax History Compared to Growth
Tax History
| Year | Tax Paid | Tax Assessment Tax Assessment Total Assessment is a certain percentage of the fair market value that is determined by local assessors to be the total taxable value of land and additions on the property. | Land | Improvement |
|---|---|---|---|---|
| 2024 | $3,830 | $104,240 | $12,000 | $92,240 |
| 2023 | $3,181 | $86,000 | $12,000 | $74,000 |
| 2022 | $1,813 | $78,840 | $12,000 | $66,840 |
| 2021 | $1,679 | $72,640 | $12,000 | $60,640 |
| 2020 | $1,423 | $61,240 | $12,000 | $49,240 |
| 2019 | $1,423 | $61,240 | $12,000 | $49,240 |
| 2018 | $1,423 | $61,240 | $12,000 | $49,240 |
| 2017 | $1,424 | $61,240 | $12,000 | $49,240 |
| 2016 | $1,426 | $61,240 | $12,000 | $49,240 |
| 2015 | $1,429 | $61,240 | $12,000 | $49,240 |
| 2014 | -- | $61,240 | $12,000 | $49,240 |
| 2013 | -- | $61,240 | $12,000 | $49,240 |
Source: Public Records
Map
Nearby Homes
- 414 Newport Ave
- 416 Red Hawk Pointe
- 106 Krider Ct
- 701 Amberley Ct
- 438 Newport Ave
- 126 Hawk's Nest Dr
- 108 Bella Ct
- 207 Amberley Ct
- 231 Black Hawke Ln
- 106 Lila Kate Ct
- 203 Amberley Ct Unit 105
- 203 Amberley Ct
- 105 Grey Hawk Ct
- 123 Amberley Ct
- 204 Black Hawke Ln
- 192 Talton Rd
- 162 Talton Rd
- 2403 Ga Hwy 127
- 103 Westchester Trail
- 0 Galloway St Unit 7225673
- 0 Galloway St Unit 3248290
- 0 Galloway St Unit 8824930
- 0 Galloway St Unit 8623952
- 0 Galloway St Unit 8326512
- 114 Galloway St
- 110 Galloway St
- 111 Huntley Dr
- 115 Huntley Dr
- 113 Huntley Dr
- 109 Huntley Dr
- 116 Galloway St
- 117 Huntley Dr
- 111 Galloway St
- 108 Galloway St
- 107 Huntley Dr
- 119 Huntley Dr
- 118 Galloway St
- 109 Galloway St
- 0 Huntley Dr Unit 7405805