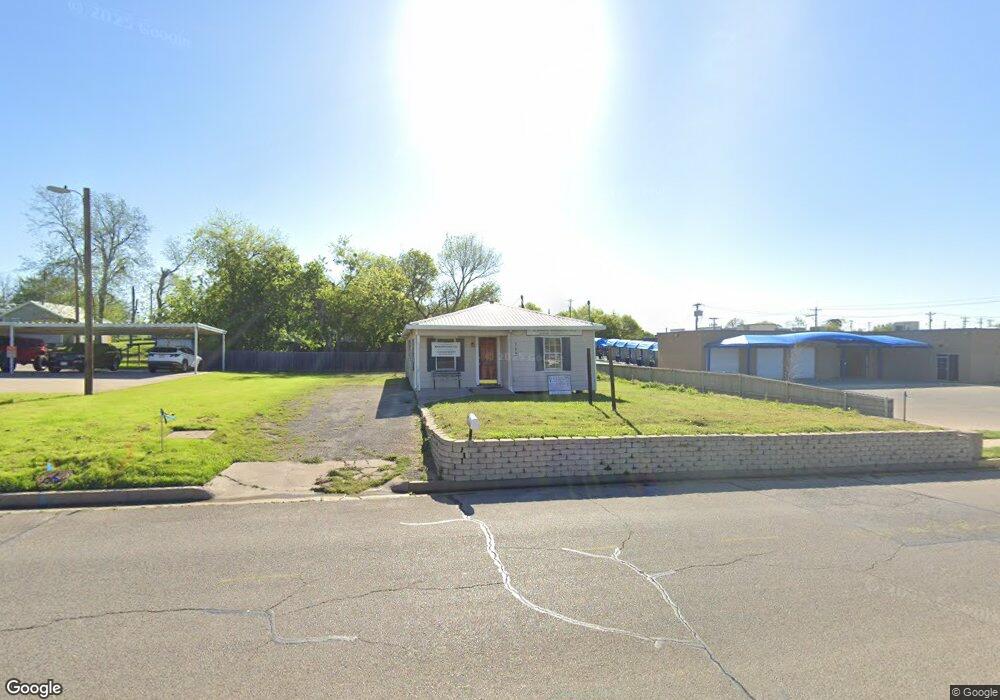
112 Hogle St Weatherford, TX 76086
Estimated Value: $84,000
--
Bed
--
Bath
1,008
Sq Ft
$83/Sq Ft
Est. Value
About This Home
This home is located at 112 Hogle St, Weatherford, TX 76086 and is currently priced at $84,000, approximately $83 per square foot. 112 Hogle St is a home located in Parker County with nearby schools including Crockett Elementary School, Tison Middle School, and Weatherford High School.
Ownership History
Date
Name
Owned For
Owner Type
Purchase Details
Closed on
Jun 2, 2023
Sold by
Oconnor Michael
Bought by
Rjn Justice Center Llc
Current Estimated Value
Purchase Details
Closed on
May 24, 2023
Sold by
Plumlee Teresa Diane
Bought by
Oconnor Michael
Purchase Details
Closed on
Dec 29, 2014
Sold by
Plumlee Joe Bob and Plumlee Theresa D
Bought by
Plumlee Joe Bob and Plumlee Teresa
Purchase Details
Closed on
Jul 23, 2009
Sold by
Connaway Donald C and Connaway Beverly C
Bought by
Plumlee Joe Bob and Plumlee Teresa Diane
Home Financials for this Owner
Home Financials are based on the most recent Mortgage that was taken out on this home.
Original Mortgage
$67,200
Interest Rate
5.71%
Mortgage Type
Purchase Money Mortgage
Purchase Details
Closed on
Feb 1, 1978
Bought by
Plumlee Joe Bob and Plumlee Teresa
Create a Home Valuation Report for This Property
The Home Valuation Report is an in-depth analysis detailing your home's value as well as a comparison with similar homes in the area
Home Values in the Area
Average Home Value in this Area
Purchase History
| Date | Buyer | Sale Price | Title Company |
|---|---|---|---|
| Rjn Justice Center Llc | -- | None Listed On Document | |
| Oconnor Michael | -- | None Listed On Document | |
| Plumlee Joe Bob | -- | -- | |
| Plumlee Joe Bob | -- | None Available | |
| Plumlee Joe Bob | -- | -- |
Source: Public Records
Mortgage History
| Date | Status | Borrower | Loan Amount |
|---|---|---|---|
| Previous Owner | Plumlee Joe Bob | $67,200 |
Source: Public Records
Tax History Compared to Growth
Tax History
| Year | Tax Paid | Tax Assessment Tax Assessment Total Assessment is a certain percentage of the fair market value that is determined by local assessors to be the total taxable value of land and additions on the property. | Land | Improvement |
|---|---|---|---|---|
| 2025 | $2,297 | $189,560 | $40,000 | $149,560 |
| 2024 | $2,297 | $119,170 | $40,000 | $79,170 |
| 2023 | $2,297 | $119,170 | $40,000 | $79,170 |
| 2022 | $1,703 | $76,790 | $15,000 | $61,790 |
| 2021 | $1,844 | $76,790 | $15,000 | $61,790 |
| 2020 | $1,810 | $74,890 | $15,000 | $59,890 |
| 2019 | $1,912 | $74,890 | $15,000 | $59,890 |
| 2018 | $1,815 | $70,770 | $15,000 | $55,770 |
| 2017 | $1,862 | $70,770 | $15,000 | $55,770 |
| 2016 | $1,855 | $70,490 | $15,000 | $55,490 |
| 2015 | $1,816 | $70,490 | $15,000 | $55,490 |
| 2014 | $1,701 | $67,720 | $15,000 | $52,720 |
Source: Public Records
Map
Nearby Homes
- 109 N Mill St
- 215 S Denton St
- 213 S Line St
- 1003 E Columbia St
- 606 N Mill St
- 507 N Rusk St
- 321 S Rusk St
- 225 Legacy Blvd
- 710 Narrow St
- 210 Legacy Blvd
- TBD Vine St
- Lot 14 Clover Cir
- 202 Legacy Blvd
- Lot 15 Clover Cir
- 318 E Lee Ave
- 309 Soward Ave
- 318 S Walnut St
- 752 Common St
- 313 Throckmorton St
- 601 S Rusk St
- 113 N Weilland St
- 000 Johnson
- 115 N Weilland St
- 701 Johnson St
- 705 Johnson St
- 112 N Weilland St
- 114 N Weilland St
- 110 N Weilland St
- 707 Johnson St
- 801 Johnson St
- 803 Johnson St
- 802 Johnson St
- 710 Jameson St
- 805 Johnson St
- 712 Jameson St
- 802 Jameson St
- 702 Fort Worth Hwy
- 00 Weiland
- 809 Johnson St
- 804 Jameson St