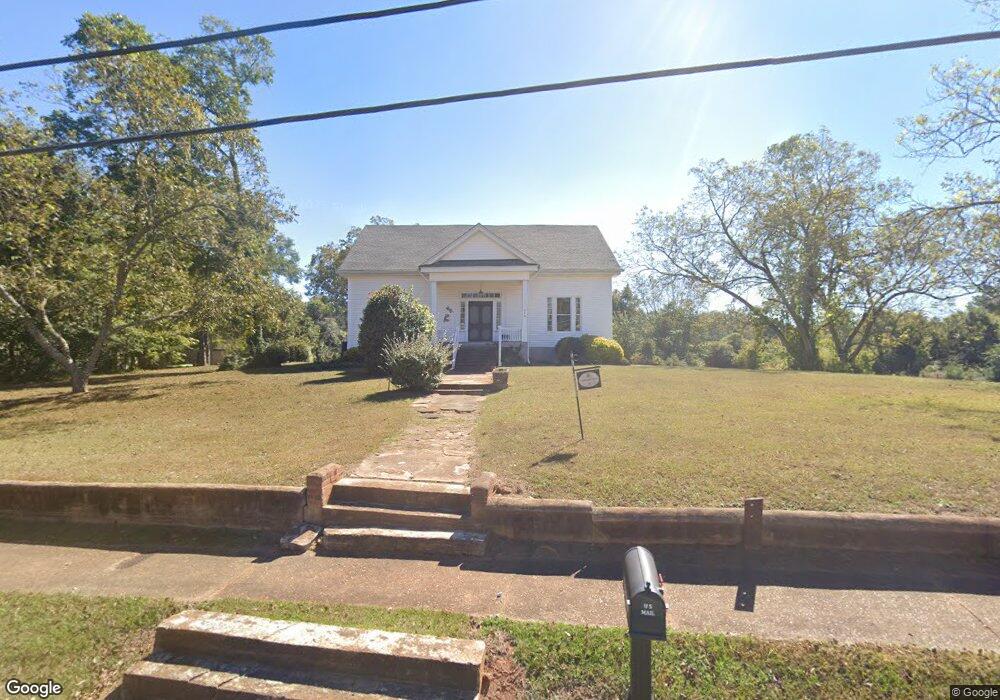
112 Lagrange St Grantville, GA 30220
Estimated Value: $261,000 - $302,000
3
Beds
2
Baths
2,701
Sq Ft
$106/Sq Ft
Est. Value
About This Home
This home is located at 112 Lagrange St, Grantville, GA 30220 and is currently estimated at $286,139, approximately $105 per square foot. 112 Lagrange St is a home located in Coweta County with nearby schools including Glanton Elementary School, Smokey Road Middle School, and Newnan High School.
Ownership History
Date
Name
Owned For
Owner Type
Purchase Details
Closed on
Aug 29, 2007
Sold by
Bowling Ada C S
Bought by
Nestlehutt Jerald W
Current Estimated Value
Purchase Details
Closed on
Feb 19, 2002
Sold by
Palmer Darwin B
Bought by
Palmer Scott B
Purchase Details
Closed on
Sep 15, 1998
Sold by
Bennett Andrea S
Bought by
Palmer Darwin and Palmer Patricia
Home Financials for this Owner
Home Financials are based on the most recent Mortgage that was taken out on this home.
Original Mortgage
$44,000
Interest Rate
6.95%
Mortgage Type
New Conventional
Purchase Details
Closed on
Jun 25, 1997
Sold by
Smith Harry C
Bought by
Bennett Andrea S
Home Financials for this Owner
Home Financials are based on the most recent Mortgage that was taken out on this home.
Original Mortgage
$40,800
Interest Rate
7.93%
Mortgage Type
New Conventional
Purchase Details
Closed on
Feb 15, 1994
Bought by
Smith Harry C
Create a Home Valuation Report for This Property
The Home Valuation Report is an in-depth analysis detailing your home's value as well as a comparison with similar homes in the area
Purchase History
| Date | Buyer | Sale Price | Title Company |
|---|---|---|---|
| Nestlehutt Jerald W | $145,500 | -- | |
| Palmer Scott B | -- | -- | |
| Palmer Darwin | $55,000 | -- | |
| Bennett Andrea S | $48,000 | -- | |
| Smith Harry C | -- | -- |
Source: Public Records
Mortgage History
| Date | Status | Borrower | Loan Amount |
|---|---|---|---|
| Previous Owner | Palmer Darwin | $44,000 | |
| Previous Owner | Bennett Andrea S | $40,800 |
Source: Public Records
Tax History
| Year | Tax Paid | Tax Assessment Tax Assessment Total Assessment is a certain percentage of the fair market value that is determined by local assessors to be the total taxable value of land and additions on the property. | Land | Improvement |
|---|---|---|---|---|
| 2025 | $2,807 | $102,452 | $10,000 | $92,452 |
| 2024 | $2,747 | $100,328 | $10,000 | $90,328 |
| 2023 | $2,747 | $81,666 | $10,000 | $71,666 |
Source: Public Records
Map
Nearby Homes
- 21 Shepard St
- 26 Magnolia St
- 24 Chelsea Ln
- 37 Colley St
- 309 Lagrange St
- 108 Lone Oak St
- 110 Lone Oak St
- 96 Griffin St
- 7 Post St
- 39 Canterbury Dr
- 15 Huntington Dr
- 2 Ray Way
- 74 Canterbury Dr
- 49 Canterbury Dr
- 75 Canterbury Dr
- 128 Calico Loop
- 0 Highway 0029 Unit 10619140
- 151 Grandma Branch Rd
- 00 Bohannon Rd
- 0 Bohannon Rd Unit 24753931
- 18 Moreland St
- 100 Lagrange St
- 148 Lagrange St
- 103 Moreland St
- 99 Lagrange St
- 78 Moreland St
- 150 Lagrange St
- W W Broad St
- 85 Lagrange St
- 162 Lagrange St
- 75 Moreland St
- 153 Lagrange St
- 82 Banks St
- 8 Sims St
- 76 Banks St
- 62 Lagrange St
- 73 Lagrange St
- 73 Lagrange St Unit 127
- 127 Lagrange St
- 174 Lagrange St
Your Personal Tour Guide
Ask me questions while you tour the home.