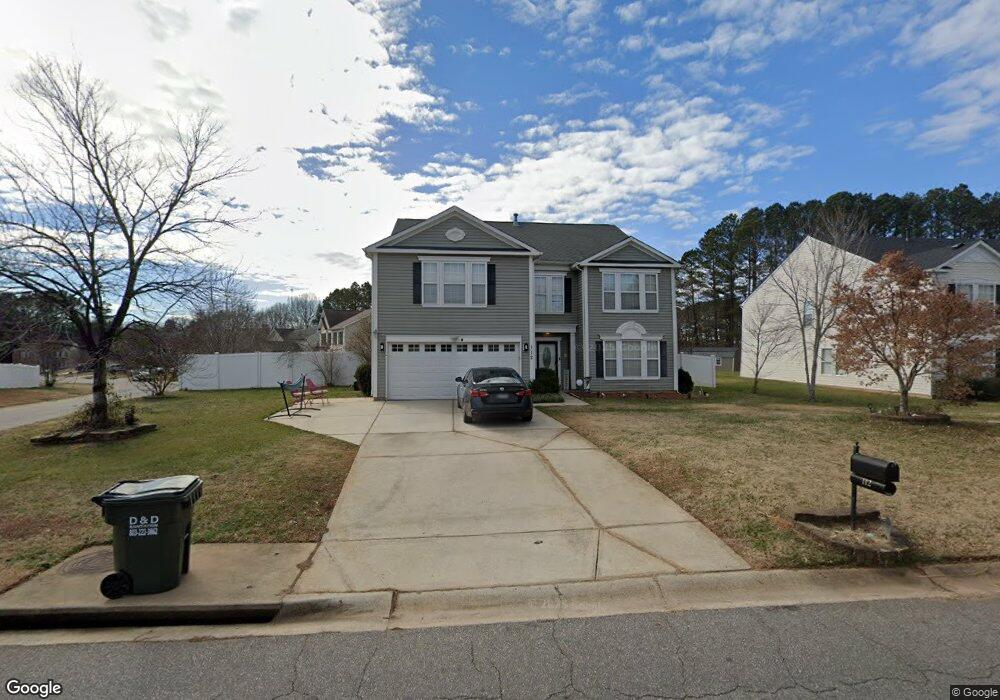
112 Longlea Dr Unit 94 Clover, SC 29710
Estimated Value: $437,363 - $460,000
6
Beds
3
Baths
3,644
Sq Ft
$123/Sq Ft
Est. Value
About This Home
This home is located at 112 Longlea Dr Unit 94, Clover, SC 29710 and is currently estimated at $449,841, approximately $123 per square foot. 112 Longlea Dr Unit 94 is a home located in York County with nearby schools including Griggs Road Elementary School, Clover Middle School, and Clover High School.
Ownership History
Date
Name
Owned For
Owner Type
Purchase Details
Closed on
Jul 22, 2016
Sold by
Scott Joseph B and Scott Cynthia J
Bought by
Smith Judy C and Duncan Clevon
Current Estimated Value
Home Financials for this Owner
Home Financials are based on the most recent Mortgage that was taken out on this home.
Original Mortgage
$235,653
Outstanding Balance
$187,370
Interest Rate
3.54%
Mortgage Type
FHA
Estimated Equity
$262,471
Purchase Details
Closed on
Mar 10, 2006
Sold by
The Matherson Co Inc
Bought by
C P Morgan Communities Of Charlotte Llc
Purchase Details
Closed on
May 26, 2005
Sold by
C P Morgan Communities Of Charlotte Llc
Bought by
Scott Joseph B and Scott Cynthia J
Home Financials for this Owner
Home Financials are based on the most recent Mortgage that was taken out on this home.
Original Mortgage
$154,570
Interest Rate
6.5%
Mortgage Type
New Conventional
Create a Home Valuation Report for This Property
The Home Valuation Report is an in-depth analysis detailing your home's value as well as a comparison with similar homes in the area
Home Values in the Area
Average Home Value in this Area
Purchase History
| Date | Buyer | Sale Price | Title Company |
|---|---|---|---|
| Smith Judy C | $240,000 | None Available | |
| C P Morgan Communities Of Charlotte Llc | $219,420 | None Available | |
| Scott Joseph B | $194,595 | None Available |
Source: Public Records
Mortgage History
| Date | Status | Borrower | Loan Amount |
|---|---|---|---|
| Open | Smith Judy C | $235,653 | |
| Previous Owner | Scott Joseph B | $154,570 |
Source: Public Records
Tax History Compared to Growth
Tax History
| Year | Tax Paid | Tax Assessment Tax Assessment Total Assessment is a certain percentage of the fair market value that is determined by local assessors to be the total taxable value of land and additions on the property. | Land | Improvement |
|---|---|---|---|---|
| 2025 | $1,666 | $12,167 | $1,516 | $10,651 |
| 2024 | $1,495 | $10,580 | $1,488 | $9,092 |
| 2023 | $1,533 | $10,580 | $1,488 | $9,092 |
| 2022 | $1,263 | $10,580 | $1,488 | $9,092 |
| 2021 | -- | $10,580 | $1,488 | $9,092 |
| 2020 | $1,198 | $10,580 | $0 | $0 |
| 2019 | $1,136 | $9,200 | $0 | $0 |
| 2018 | $1,142 | $9,200 | $0 | $0 |
| 2017 | $4,642 | $9,200 | $0 | $0 |
| 2016 | $747 | $10,290 | $0 | $0 |
| 2014 | $951 | $6,860 | $1,000 | $5,860 |
| 2013 | $951 | $8,340 | $1,200 | $7,140 |
Source: Public Records
Map
Nearby Homes
- 961 Poplar Forest Ridge
- 1300 Dunmore Ct
- 1909 Leesburg Dr
- 1961 Leesburg Dr
- 1965 Leesburg Dr
- 2104 Gillette Dr
- 2718 Odessa Dr
- 3079 Riker St
- 1817 Tradd Ave
- 1821 Tradd Ave
- 1876 Tradd Ave
- 1288 Century Dr
- 1280 Century Dr
- 1223 Century Dr
- 1219 Century Dr
- 2599 Highway 557 None
- 633 Cassidy Ct
- 629 Cassidy Ct
- 625 Cassidy Ct
- 320 Laura Elizabeth Ln
- 112 Longlea Dr
- 108 Longlea Dr
- 501 Danfield Dr Unit 1
- 501 Danfield Dr
- 306 Logan Place
- 116 Longlea Dr
- 104 Longlea Dr
- 120 Longlea Dr
- 500 Danfield Dr
- 505 Danfield Dr
- 100 Longlea Dr
- 310 Logan Place
- 307 Logan Place
- 504 Danfield Dr
- 509 Danfield Dr
- 124 Longlea Dr
- 2073 Highway 557 None
- 2073 Highway 557
- 314 Logan Place
- 513 Danfield Dr