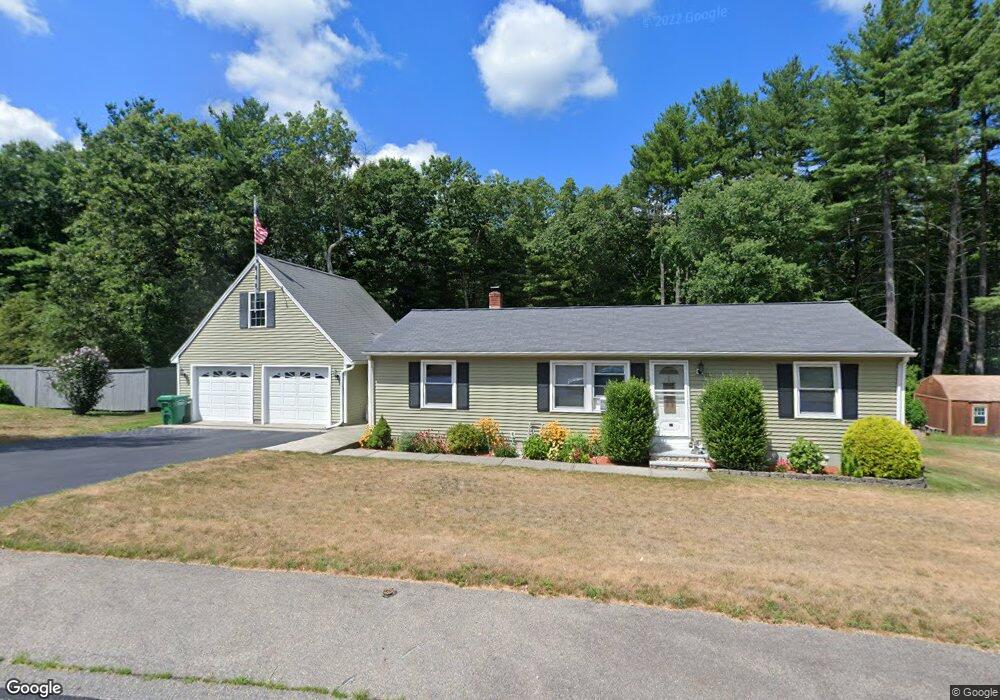
112 Lovelace Ln Northbridge, MA 01534
Estimated Value: $433,659 - $470,000
3
Beds
3
Baths
1,224
Sq Ft
$366/Sq Ft
Est. Value
About This Home
This home is located at 112 Lovelace Ln, Northbridge, MA 01534 and is currently estimated at $447,665, approximately $365 per square foot. 112 Lovelace Ln is a home located in Worcester County with nearby schools including Northbridge Elementary School, Northbridge Middle School, and Northbridge High School.
Ownership History
Date
Name
Owned For
Owner Type
Purchase Details
Closed on
Dec 6, 2012
Sold by
Coldwell Joann
Bought by
Coldwell Joann and Coldwell Dale M
Current Estimated Value
Purchase Details
Closed on
Oct 31, 1997
Sold by
Lachapelle Dennis M
Bought by
Lachapelle Joann
Create a Home Valuation Report for This Property
The Home Valuation Report is an in-depth analysis detailing your home's value as well as a comparison with similar homes in the area
Home Values in the Area
Average Home Value in this Area
Purchase History
| Date | Buyer | Sale Price | Title Company |
|---|---|---|---|
| Coldwell Joann | -- | -- | |
| Coldwell Joann | -- | -- | |
| Lachapelle Joann | $10,000 | -- | |
| Lachapelle Joann | $10,000 | -- |
Source: Public Records
Mortgage History
| Date | Status | Borrower | Loan Amount |
|---|---|---|---|
| Previous Owner | Lachapelle Joann | $139,500 | |
| Previous Owner | Lachapelle Joann | $112,000 |
Source: Public Records
Tax History
| Year | Tax Paid | Tax Assessment Tax Assessment Total Assessment is a certain percentage of the fair market value that is determined by local assessors to be the total taxable value of land and additions on the property. | Land | Improvement |
|---|---|---|---|---|
| 2025 | $4,674 | $396,400 | $137,300 | $259,100 |
| 2024 | $4,568 | $377,800 | $137,300 | $240,500 |
| 2023 | $4,706 | $363,100 | $137,300 | $225,800 |
| 2022 | $4,152 | $301,500 | $105,600 | $195,900 |
| 2021 | $3,975 | $274,300 | $100,500 | $173,800 |
| 2020 | $3,694 | $266,900 | $100,500 | $166,400 |
| 2019 | $3,342 | $257,700 | $100,500 | $157,200 |
| 2018 | $7,323 | $245,500 | $95,700 | $149,800 |
| 2017 | $3,173 | $234,500 | $95,700 | $138,800 |
| 2016 | $3,053 | $222,000 | $87,000 | $135,000 |
| 2015 | $2,970 | $222,000 | $87,000 | $135,000 |
| 2014 | $2,944 | $222,000 | $87,000 | $135,000 |
Source: Public Records
Map
Nearby Homes
- 5 S Main St
- 69-71 Providence Rd
- 0 Puddon St
- 1825 Quaker St
- 2248 Providence Rd
- 2294 Providence Rd
- 35 School St Unit 35
- 659 Highland St
- 0 Emond St Unit 1
- 0 Emond St Unit 73480228
- 90 Windstone Dr
- 2428-2430 Providence Rd
- 24 Mcquades Ln
- 3 Mendon Rd
- 4 Mendon Rd
- 220 Alana Dr
- 86 Kingsnorth St
- 99 W River St
- 140 Rolling Ridge Dr Unit 78
- 240 Roosevelt Dr
Your Personal Tour Guide
Ask me questions while you tour the home.