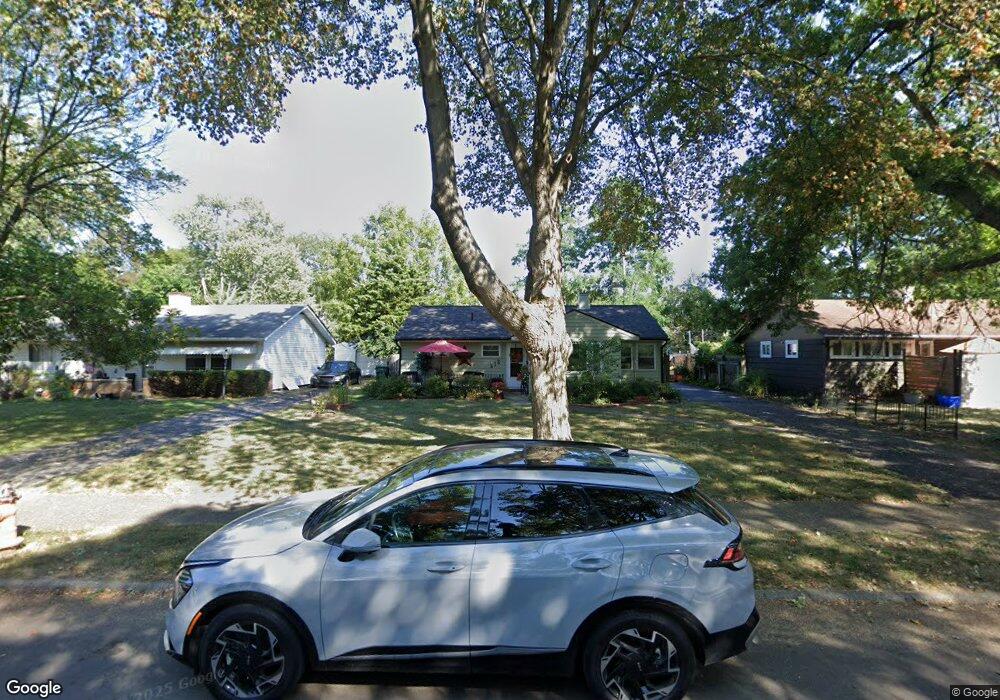
112 Lowell Rd Columbus, OH 43209
Broadleigh NeighborhoodEstimated Value: $188,680 - $240,000
3
Beds
1
Bath
1,056
Sq Ft
$197/Sq Ft
Est. Value
About This Home
This home is located at 112 Lowell Rd, Columbus, OH 43209 and is currently estimated at $208,170, approximately $197 per square foot. 112 Lowell Rd is a home located in Franklin County with nearby schools including Broadleigh Elementary School, Johnson Park Middle School, and Walnut Ridge High School.
Ownership History
Date
Name
Owned For
Owner Type
Purchase Details
Closed on
Sep 21, 2015
Sold by
Kyle Audra D and Kyle Sharlene L
Bought by
Tapp Kimberly S
Current Estimated Value
Home Financials for this Owner
Home Financials are based on the most recent Mortgage that was taken out on this home.
Original Mortgage
$72,750
Outstanding Balance
$57,140
Interest Rate
3.91%
Mortgage Type
New Conventional
Estimated Equity
$151,030
Purchase Details
Closed on
Nov 11, 2005
Sold by
Kyle Sharlene L
Bought by
Kyle Sharlene L and Kyle Audra D
Purchase Details
Closed on
Aug 10, 2001
Sold by
Young Angeline
Bought by
Kyle Sharlene L
Home Financials for this Owner
Home Financials are based on the most recent Mortgage that was taken out on this home.
Original Mortgage
$75,262
Interest Rate
7.28%
Mortgage Type
FHA
Purchase Details
Closed on
Dec 4, 1989
Bought by
Young Angeline
Create a Home Valuation Report for This Property
The Home Valuation Report is an in-depth analysis detailing your home's value as well as a comparison with similar homes in the area
Home Values in the Area
Average Home Value in this Area
Purchase History
| Date | Buyer | Sale Price | Title Company |
|---|---|---|---|
| Tapp Kimberly S | $77,500 | Attorney | |
| Kyle Sharlene L | -- | -- | |
| Kyle Sharlene L | $75,900 | -- | |
| Young Angeline | $59,500 | -- |
Source: Public Records
Mortgage History
| Date | Status | Borrower | Loan Amount |
|---|---|---|---|
| Open | Tapp Kimberly S | $72,750 | |
| Previous Owner | Kyle Sharlene L | $75,262 |
Source: Public Records
Tax History Compared to Growth
Tax History
| Year | Tax Paid | Tax Assessment Tax Assessment Total Assessment is a certain percentage of the fair market value that is determined by local assessors to be the total taxable value of land and additions on the property. | Land | Improvement |
|---|---|---|---|---|
| 2024 | $2,532 | $56,420 | $17,220 | $39,200 |
| 2023 | $2,500 | $56,420 | $17,220 | $39,200 |
| 2022 | $1,527 | $29,440 | $7,390 | $22,050 |
| 2021 | $1,530 | $29,440 | $7,390 | $22,050 |
| 2020 | $1,532 | $29,440 | $7,390 | $22,050 |
| 2019 | $1,465 | $24,150 | $6,160 | $17,990 |
| 2018 | $1,337 | $24,150 | $6,160 | $17,990 |
| 2017 | $1,464 | $24,150 | $6,160 | $17,990 |
| 2016 | $1,336 | $20,170 | $4,520 | $15,650 |
| 2015 | $1,213 | $20,170 | $4,520 | $15,650 |
| 2014 | $1,216 | $20,170 | $4,520 | $15,650 |
| 2013 | $631 | $21,210 | $4,760 | $16,450 |
Source: Public Records
Map
Nearby Homes
- 3235 Maryland Ave
- 238 Edgevale Rd
- 73 N Everett Ave
- 243 N James Rd
- 253 N James Rd
- 177 N James Rd
- 46 N Everett Ave
- 94 N Hampton Rd
- 50 N Broadleigh Rd
- 88-90 N Waverly St
- 205 N Gould Rd
- 239 S Kellner Rd
- 247 S James Rd
- 277 S James Rd
- 201 S Weyant Ave
- 354 N Roosevelt Ave Unit 356
- 178 S Weyant Ave
- 142 S Gould Rd
- 91 Maplewood Ave
- 2738 E Broad St