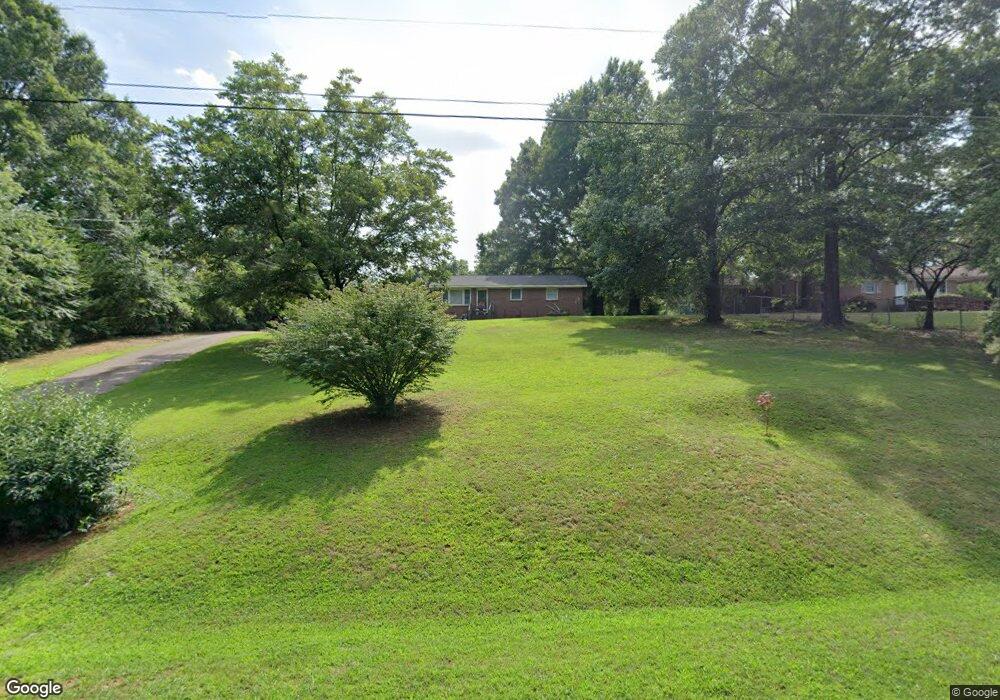
112 Luthers Rd Kings Mountain, NC 28086
Estimated Value: $181,383 - $218,000
3
Beds
1
Bath
1,020
Sq Ft
$196/Sq Ft
Est. Value
About This Home
This home is located at 112 Luthers Rd, Kings Mountain, NC 28086 and is currently estimated at $199,846, approximately $195 per square foot. 112 Luthers Rd is a home located in Cleveland County with nearby schools including Bethware Elementary School, Kings Mountain Intermediate School, and Kings Mountain Middle.
Ownership History
Date
Name
Owned For
Owner Type
Purchase Details
Closed on
Apr 3, 2018
Sold by
Putnam David B
Bought by
Putnam David B and Ramsey Teresa
Current Estimated Value
Purchase Details
Closed on
Apr 24, 2013
Sold by
Putnam David B and Putman Krista
Bought by
Putnam David B
Purchase Details
Closed on
Oct 28, 2010
Sold by
Jenkins Robert T and Jenkins Betty J
Bought by
Putnam David B
Home Financials for this Owner
Home Financials are based on the most recent Mortgage that was taken out on this home.
Original Mortgage
$67,983
Outstanding Balance
$44,808
Interest Rate
4.25%
Mortgage Type
FHA
Estimated Equity
$155,038
Purchase Details
Closed on
May 26, 2010
Sold by
Homesales Inc
Bought by
Jenkins Robert T and Jenkins Betty J
Purchase Details
Closed on
Feb 11, 2010
Sold by
Gibbons Mary W and Gibbons Bruce
Bought by
Jpmorgan Chase Bank Na and Jpmorgan Chase Bank
Create a Home Valuation Report for This Property
The Home Valuation Report is an in-depth analysis detailing your home's value as well as a comparison with similar homes in the area
Home Values in the Area
Average Home Value in this Area
Purchase History
| Date | Buyer | Sale Price | Title Company |
|---|---|---|---|
| Putnam David B | -- | None Available | |
| Putnam David B | -- | None Available | |
| Putnam David B | $69,000 | None Available | |
| Jenkins Robert T | $15,000 | None Available | |
| Homesales Inc | -- | None Available | |
| Jpmorgan Chase Bank Na | $31,456 | None Available |
Source: Public Records
Mortgage History
| Date | Status | Borrower | Loan Amount |
|---|---|---|---|
| Open | Putnam David B | $67,983 |
Source: Public Records
Tax History
| Year | Tax Paid | Tax Assessment Tax Assessment Total Assessment is a certain percentage of the fair market value that is determined by local assessors to be the total taxable value of land and additions on the property. | Land | Improvement |
|---|---|---|---|---|
| 2025 | $778 | $122,581 | $24,253 | $98,328 |
| 2024 | $662 | $73,189 | $17,757 | $55,432 |
| 2023 | $659 | $73,189 | $17,757 | $55,432 |
| 2022 | $659 | $73,189 | $17,757 | $55,432 |
| 2021 | $660 | $73,189 | $17,757 | $55,432 |
| 2020 | $605 | $64,188 | $17,324 | $46,864 |
| 2019 | $605 | $64,188 | $17,324 | $46,864 |
| 2018 | $601 | $64,188 | $17,324 | $46,864 |
| 2017 | $598 | $64,188 | $17,324 | $46,864 |
| 2016 | $569 | $64,188 | $17,324 | $46,864 |
| 2015 | $540 | $60,443 | $12,334 | $48,109 |
| 2014 | $540 | $60,443 | $12,334 | $48,109 |
Source: Public Records
Map
Nearby Homes
- 124 Harbourtown Dr Unit 30
- 104 Preston Trail
- 417 Stony Point Rd
- 110 Cypress Point Dr
- 203 Williams Rd
- 116 Maple Crest Dr
- 104 Lakewood Dr
- 137 Colton Ct
- 936 New Camp Creek Church Rd
- 108 Three Oaks Ln
- 102 Starmount Dr
- 103 Starmount Dr
- 106 Williams Rd
- 105 Ager Dr
- 5067 E Dixon Blvd
- 160 Quail Hollow Dr
- 113 Quail Hollow Dr
- 117 Wright Rd
- 107 Stony Point Rd
- 103 Stony Point Rd
- 110 Luthers Rd
- 114 Luthers Rd
- 106 Luthers Rd
- 106 Luthers Rd
- 1201 Oak Grove Rd
- 1213 Oak Grove Rd
- 1147 Oak Grove Rd
- 1145 Oak Grove Rd
- 1209 Oak Grove Rd
- 1143 Oak Grove Rd
- 126 Luthers Rd
- 1141 Oak Grove Rd
- 1211 Oak Grove Rd
- 115 Rosey Ln
- 1139 Oak Grove Rd
- 128 Luthers Rd
- 1140 Oak Grove Rd
- 132 Luthers Rd
- 121 Rosey Ln
- 122 Luthers Rd
Your Personal Tour Guide
Ask me questions while you tour the home.