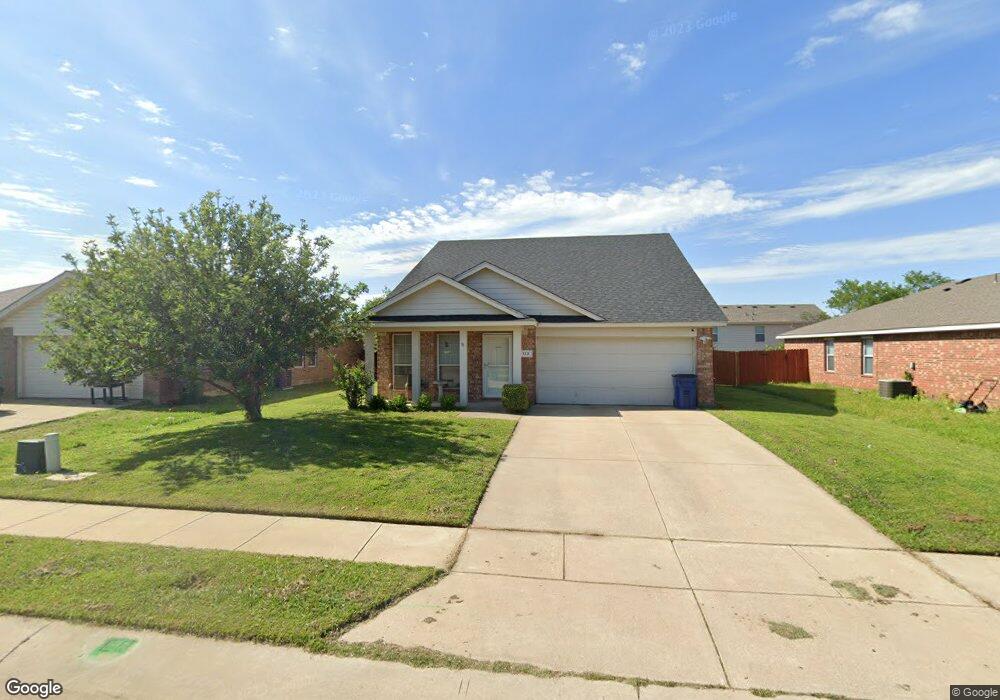
112 Maned Dr Sanger, TX 76266
Estimated Value: $275,187 - $287,000
4
Beds
2
Baths
1,596
Sq Ft
$176/Sq Ft
Est. Value
About This Home
This home is located at 112 Maned Dr, Sanger, TX 76266 and is currently estimated at $280,297, approximately $175 per square foot. 112 Maned Dr is a home located in Denton County with nearby schools including Chisholm Trail Elementary School, Clear Creek Intermediate School, and Sanger Sixth Grade Campus.
Ownership History
Date
Name
Owned For
Owner Type
Purchase Details
Closed on
Sep 8, 2017
Sold by
Smith Roger M
Bought by
Smith Joshua Roger
Current Estimated Value
Home Financials for this Owner
Home Financials are based on the most recent Mortgage that was taken out on this home.
Original Mortgage
$134,500
Outstanding Balance
$112,407
Interest Rate
3.93%
Mortgage Type
New Conventional
Estimated Equity
$167,890
Purchase Details
Closed on
Jun 12, 2006
Sold by
Smith Roger M and Smith Roger Michael
Bought by
The Roger M Smith Revocable Living Trust
Purchase Details
Closed on
Feb 28, 2006
Sold by
D R Horton Texas Ltd
Bought by
Smith Roger Michael
Home Financials for this Owner
Home Financials are based on the most recent Mortgage that was taken out on this home.
Original Mortgage
$96,000
Interest Rate
6.05%
Mortgage Type
Fannie Mae Freddie Mac
Create a Home Valuation Report for This Property
The Home Valuation Report is an in-depth analysis detailing your home's value as well as a comparison with similar homes in the area
Home Values in the Area
Average Home Value in this Area
Purchase History
| Date | Buyer | Sale Price | Title Company |
|---|---|---|---|
| Smith Joshua Roger | -- | None Available | |
| The Roger M Smith Revocable Living Trust | -- | None Available | |
| Smith Roger Michael | -- | Dhi Title |
Source: Public Records
Mortgage History
| Date | Status | Borrower | Loan Amount |
|---|---|---|---|
| Open | Smith Joshua Roger | $134,500 | |
| Closed | Smith Roger Michael | $96,000 |
Source: Public Records
Tax History Compared to Growth
Tax History
| Year | Tax Paid | Tax Assessment Tax Assessment Total Assessment is a certain percentage of the fair market value that is determined by local assessors to be the total taxable value of land and additions on the property. | Land | Improvement |
|---|---|---|---|---|
| 2025 | $4,239 | $279,040 | $72,765 | $206,275 |
| 2024 | $5,391 | $266,767 | $0 | $0 |
| 2023 | $3,758 | $242,515 | $59,535 | $224,852 |
| 2022 | $4,889 | $220,468 | $59,535 | $171,154 |
| 2021 | $4,212 | $200,425 | $47,959 | $152,466 |
| 2020 | $4,065 | $183,713 | $40,418 | $143,295 |
| 2019 | $4,143 | $181,960 | $40,418 | $141,542 |
| 2018 | $3,938 | $172,062 | $40,418 | $131,644 |
| 2017 | $3,680 | $160,007 | $40,418 | $119,589 |
| 2016 | $3,499 | $152,130 | $40,418 | $111,712 |
| 2015 | $2,547 | $126,781 | $26,680 | $100,101 |
| 2014 | $2,547 | $118,456 | $26,680 | $91,776 |
| 2013 | -- | $107,965 | $26,680 | $82,823 |
Source: Public Records
Map
Nearby Homes
- 117 Teal Rd
- 114 Pintail Ln
- 124 Morning Glory
- 942 First St
- 108 Magnolia Dr
- 936 First St
- 319 Quail Crossing Dr
- 321 Quail Crossing Dr
- 185 Aster Dr
- 0000 Rector Rd
- 130 Southside Dr
- 226 Hillcrest St
- 202 Southland Dr
- 212 Diane Dr
- 109 Colonial Heights
- 209 Southland Dr
- 2004 S Stemmons St
- 2000 S Stemmons St
- 113 Diane Dr
- 505 Houston St