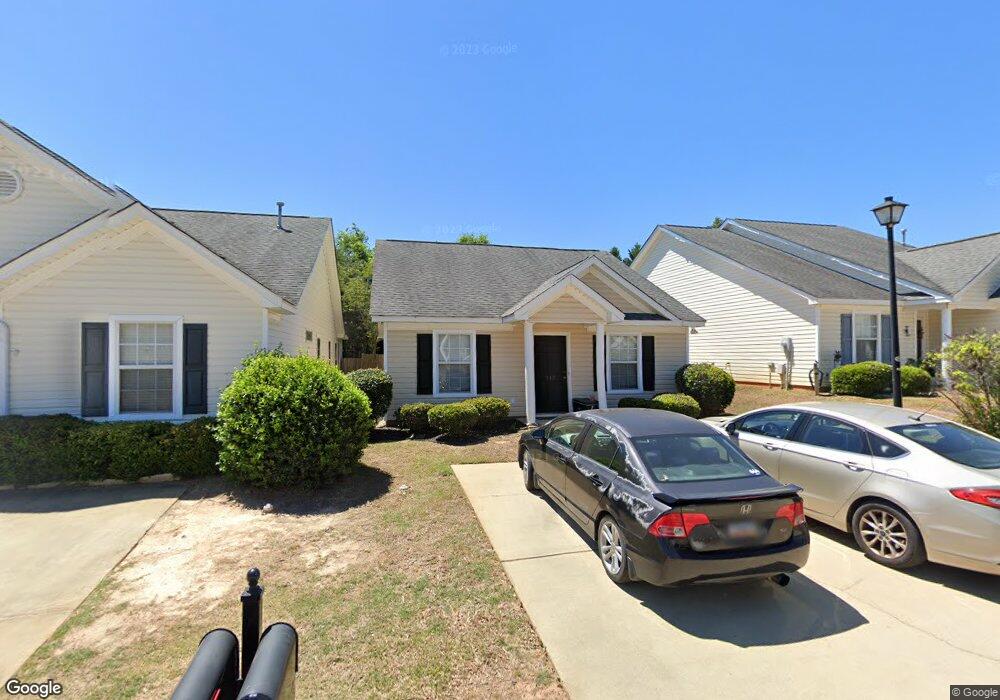
112 Merowey Ct Chapin, SC 29036
Estimated Value: $182,111 - $196,000
2
Beds
2
Baths
1,080
Sq Ft
$174/Sq Ft
Est. Value
About This Home
This home is located at 112 Merowey Ct, Chapin, SC 29036 and is currently estimated at $187,528, approximately $173 per square foot. 112 Merowey Ct is a home located in Lexington County with nearby schools including Chapin Elementary School, Chapin Intermediate, and Chapin High School.
Ownership History
Date
Name
Owned For
Owner Type
Purchase Details
Closed on
Apr 3, 2012
Sold by
Azarigian Gary L
Bought by
Family Holdings Llc
Current Estimated Value
Purchase Details
Closed on
Apr 19, 2011
Sold by
Carolina Trust Holdings Llc
Bought by
Azarigian Jason M
Home Financials for this Owner
Home Financials are based on the most recent Mortgage that was taken out on this home.
Original Mortgage
$88,200
Interest Rate
4.85%
Mortgage Type
Future Advance Clause Open End Mortgage
Purchase Details
Closed on
Mar 5, 2009
Sold by
Family Holdings Llc
Bought by
Carolina Trust Holdings Llc
Purchase Details
Closed on
Jan 18, 2006
Sold by
The Gary L Azarigian Living Trust
Bought by
Family Holdings Llc
Purchase Details
Closed on
Aug 24, 2004
Sold by
Azarigian Gary L
Bought by
The Gary L Azarigian Living Trust
Purchase Details
Closed on
Jun 14, 2004
Sold by
Fairhaven Llc
Bought by
Azarigan Gary L
Create a Home Valuation Report for This Property
The Home Valuation Report is an in-depth analysis detailing your home's value as well as a comparison with similar homes in the area
Home Values in the Area
Average Home Value in this Area
Purchase History
| Date | Buyer | Sale Price | Title Company |
|---|---|---|---|
| Family Holdings Llc | -- | -- | |
| Azarigian Gary L | -- | -- | |
| Azarigian Jason M | $98,000 | -- | |
| Carolina Trust Holdings Llc | -- | -- | |
| Family Holdings Llc | -- | None Available | |
| The Gary L Azarigian Living Trust | -- | -- | |
| Azarigan Gary L | $81,900 | -- |
Source: Public Records
Mortgage History
| Date | Status | Borrower | Loan Amount |
|---|---|---|---|
| Previous Owner | Azarigian Jason M | $88,200 |
Source: Public Records
Tax History Compared to Growth
Tax History
| Year | Tax Paid | Tax Assessment Tax Assessment Total Assessment is a certain percentage of the fair market value that is determined by local assessors to be the total taxable value of land and additions on the property. | Land | Improvement |
|---|---|---|---|---|
| 2024 | $2,847 | $5,697 | $1,050 | $4,647 |
| 2023 | $2,565 | $5,697 | $1,050 | $4,647 |
| 2022 | $2,426 | $5,697 | $1,050 | $4,647 |
| 2020 | $2,466 | $5,697 | $1,050 | $4,647 |
| 2019 | $2,306 | $5,174 | $1,050 | $4,124 |
| 2018 | $544 | $3,449 | $700 | $2,749 |
| 2017 | $526 | $3,449 | $700 | $2,749 |
| 2016 | $538 | $3,449 | $700 | $2,749 |
| 2014 | $610 | $3,919 | $700 | $3,219 |
| 2013 | -- | $3,920 | $700 | $3,220 |
Source: Public Records
Map
Nearby Homes
- 100 Recluse St
- 129 Merowey Ct
- 213 Firebridge Ct
- 428 Firebridge Dr
- 1679 Amicks Ferry Rd
- 550 Griffon Dr
- 566 Griffon Dr
- 562 Griffon Dr
- 558 Griffon Dr
- 570 Griffon Dr
- 574 Griffon Dr
- 538 Griffon Dr
- 559 Griffon Dr
- 555 Griffon Dr
- 551 Griffon Dr
- 567 Griffon Dr
- 563 Griffon Dr
- 571 Griffon Dr
- 547 Griffon Dr
- 530 Griffon Dr