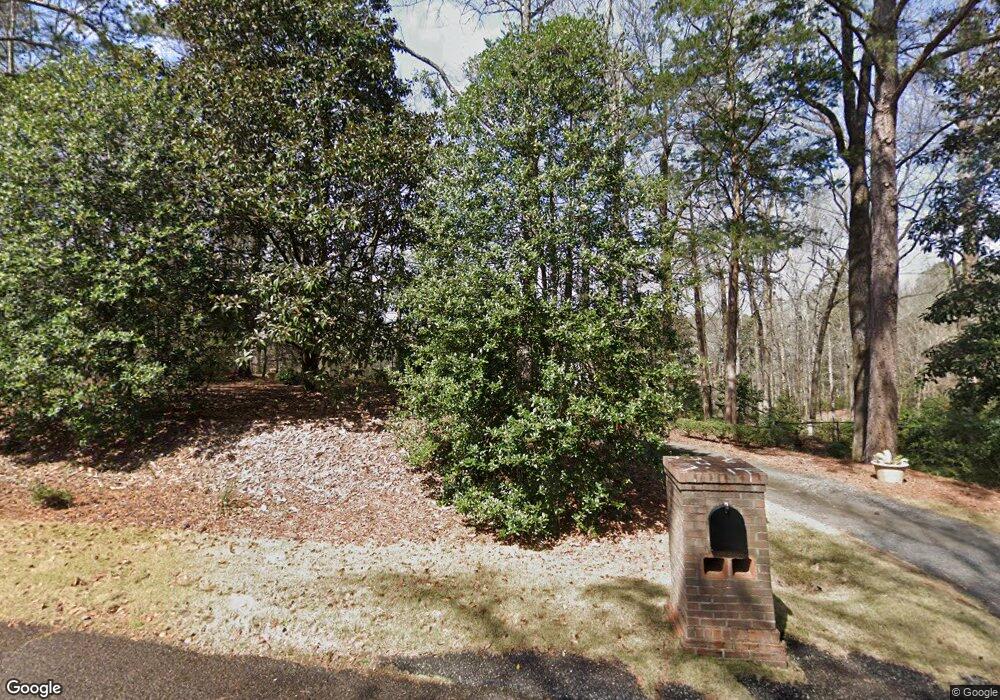
112 Midland Manor Dr Midland, GA 31820
Estimated Value: $425,000 - $544,000
3
Beds
3
Baths
2,459
Sq Ft
$197/Sq Ft
Est. Value
About This Home
This home is located at 112 Midland Manor Dr, Midland, GA 31820 and is currently estimated at $485,162, approximately $197 per square foot. 112 Midland Manor Dr is a home located in Harris County with nearby schools including Pine Ridge Elementary School, Harris County Carver Middle School, and Harris County High School.
Ownership History
Date
Name
Owned For
Owner Type
Purchase Details
Closed on
Feb 28, 2020
Sold by
Dykes Carolyn Elizabeth Batti
Bought by
Williams Darrel D and Williams Wanda A
Current Estimated Value
Home Financials for this Owner
Home Financials are based on the most recent Mortgage that was taken out on this home.
Original Mortgage
$375,000
Outstanding Balance
$332,743
Interest Rate
3.6%
Mortgage Type
VA
Estimated Equity
$152,419
Purchase Details
Closed on
Feb 12, 2020
Sold by
Dykes Carolyn Elizabeth Batti
Bought by
Dykes Carolyn Elizabeth Batti and Wilkinson Cathryn Battiato
Home Financials for this Owner
Home Financials are based on the most recent Mortgage that was taken out on this home.
Original Mortgage
$375,000
Outstanding Balance
$332,743
Interest Rate
3.6%
Mortgage Type
VA
Estimated Equity
$152,419
Purchase Details
Closed on
Mar 14, 1990
Bought by
Battiato Carolyn-Wallace
Create a Home Valuation Report for This Property
The Home Valuation Report is an in-depth analysis detailing your home's value as well as a comparison with similar homes in the area
Home Values in the Area
Average Home Value in this Area
Purchase History
| Date | Buyer | Sale Price | Title Company |
|---|---|---|---|
| Williams Darrel D | $375,000 | -- | |
| Dykes Carolyn Elizabeth Batti | -- | -- | |
| Battiato Carolyn-Wallace | $45,000 | -- |
Source: Public Records
Mortgage History
| Date | Status | Borrower | Loan Amount |
|---|---|---|---|
| Open | Williams Darrel D | $375,000 |
Source: Public Records
Tax History Compared to Growth
Tax History
| Year | Tax Paid | Tax Assessment Tax Assessment Total Assessment is a certain percentage of the fair market value that is determined by local assessors to be the total taxable value of land and additions on the property. | Land | Improvement |
|---|---|---|---|---|
| 2024 | $4,380 | $162,720 | $32,000 | $130,720 |
| 2023 | $3,644 | $152,417 | $32,000 | $120,417 |
| 2022 | $4,105 | $152,417 | $32,000 | $120,417 |
| 2021 | $4,153 | $148,729 | $32,000 | $116,729 |
| 2020 | $4,153 | $148,729 | $32,000 | $116,729 |
| 2019 | $3,266 | $120,996 | $32,000 | $88,996 |
| 2018 | $3,333 | $120,996 | $32,000 | $88,996 |
| 2017 | $3,334 | $120,996 | $32,000 | $88,996 |
| 2016 | $3,045 | $121,138 | $32,000 | $89,138 |
| 2015 | $3,051 | $121,138 | $32,000 | $89,138 |
| 2014 | $3,226 | $127,943 | $32,000 | $95,943 |
| 2013 | -- | $127,943 | $32,000 | $95,943 |
Source: Public Records
Map
Nearby Homes
- Lot 15 Oversee Ct
- 1048 Crosswinds Dr
- 239 Day Lake Dr
- 8848 Westwind Dr
- 63 Ironwood Ct
- 63 Ironwood Ct Unit 91
- 70 Fox Chase Trail
- 178 Rolling Farm Way
- 10316 Emerson Way
- 9221 Midland Woods Dr
- 10304 Emerson Way
- 10324 Emerson Way
- 1022 Christmas Ct
- 8485 Liberty Hall Dr
- 7834 Oakhurst Ct
- 8920 Midland Woods Dr
- 8139 Saddlehorn Dr
- 10146 Sable Oaks Dr
- 236 Kristi Lynns Way
- 10239 Sable Ct
- 160 Midland Manor Dr
- 50 Midland Manor Dr
- 145 Midland Manor Dr
- 9879 Warm Springs Rd
- 228 Midland Manor Dr
- 209 Midland Manor Dr
- 90 Brooke Ct
- 124 Brooke Ct
- 27 Midland Manor Dr
- 9925 Warm Springs Rd
- 60 Brooke Ct
- 4 Rocky Shoals Dr
- 132 Brooke Ct
- 1 Rocky Shoals Dr
- 9729 Warm Springs Rd
- 240 Midland Manor Dr
- 52 Brooke Ct
- 93 Brooke Ct
- 119 Brooke Ct
- 144 Brooke Ct