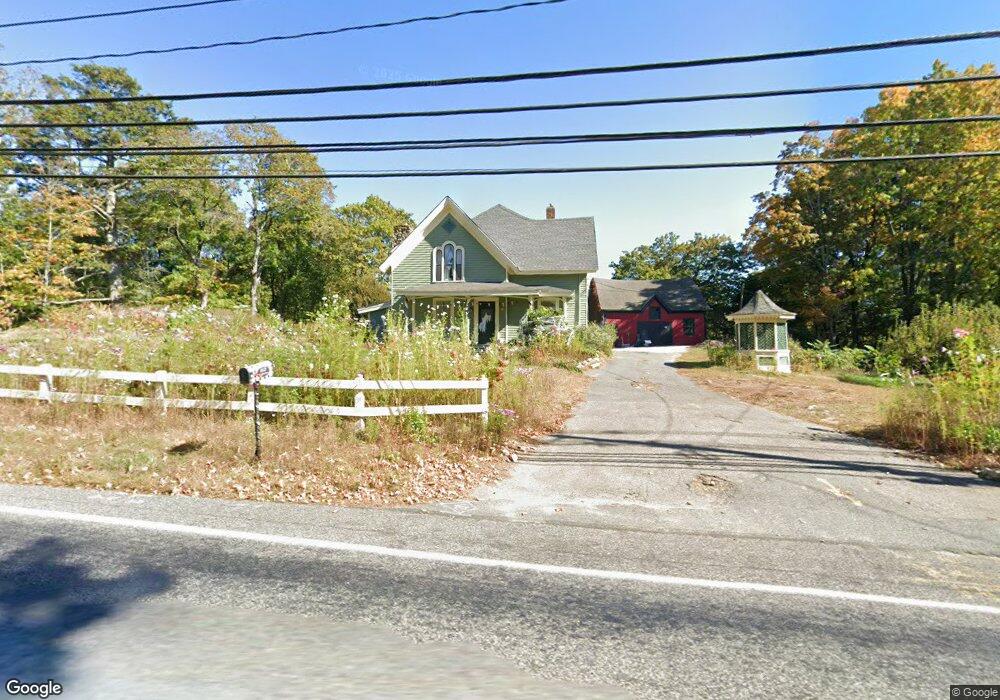
112 N Main St Sherborn, MA 01770
Estimated Value: $897,364 - $1,095,000
Studio
2
Baths
--
Sq Ft
108,900
Sq Ft Lot
About This Home
This home is located at 112 N Main St, Sherborn, MA 01770 and is currently estimated at $976,091. 112 N Main St is a home located in Middlesex County with nearby schools including Pine Hill Elementary School, Dover-Sherborn Regional Middle School, and Dover-Sherborn Regional High School.
Ownership History
Date
Name
Owned For
Owner Type
Purchase Details
Closed on
May 19, 2022
Sold by
Mottern John H
Bought by
Mottern James N and Mottern Karlina E
Current Estimated Value
Home Financials for this Owner
Home Financials are based on the most recent Mortgage that was taken out on this home.
Original Mortgage
$676,637
Outstanding Balance
$642,790
Interest Rate
5.25%
Mortgage Type
FHA
Estimated Equity
$333,301
Purchase Details
Closed on
Sep 9, 2016
Sold by
Mottern John H and Mottern Gabrielle U
Bought by
Mottern John H
Create a Home Valuation Report for This Property
The Home Valuation Report is an in-depth analysis detailing your home's value as well as a comparison with similar homes in the area
Home Values in the Area
Average Home Value in this Area
Purchase History
| Date | Buyer | Sale Price | Title Company |
|---|---|---|---|
| Mottern James N | $794,150 | None Available | |
| Mottern James N | $794,150 | None Available | |
| Mottern James N | $794,150 | None Available | |
| Mottern John H | -- | None Available | |
| Mottern John H | -- | None Available | |
| Mottern John H | -- | None Available |
Source: Public Records
Mortgage History
| Date | Status | Borrower | Loan Amount |
|---|---|---|---|
| Open | Mottern James N | $676,637 | |
| Closed | Mottern James N | $676,637 |
Source: Public Records
Tax History
| Year | Tax Paid | Tax Assessment Tax Assessment Total Assessment is a certain percentage of the fair market value that is determined by local assessors to be the total taxable value of land and additions on the property. | Land | Improvement |
|---|---|---|---|---|
| 2025 | $14,106 | $850,800 | $395,600 | $455,200 |
| 2024 | $26,527 | $782,500 | $338,100 | $444,400 |
| 2023 | $12,459 | $691,800 | $338,100 | $353,700 |
| 2022 | $11,793 | $619,700 | $335,100 | $284,600 |
| 2021 | $12,153 | $619,100 | $335,100 | $284,000 |
| 2020 | $11,799 | $606,300 | $335,100 | $271,200 |
| 2019 | $11,503 | $586,300 | $335,100 | $251,200 |
| 2018 | $11,316 | $586,300 | $335,100 | $251,200 |
| 2017 | $11,116 | $543,300 | $320,000 | $223,300 |
| 2016 | $11,176 | $543,300 | $320,000 | $223,300 |
| 2015 | $10,877 | $535,300 | $312,000 | $223,300 |
| 2014 | $10,548 | $518,600 | $295,000 | $223,600 |
Source: Public Records
Map
Nearby Homes
- 13 Morgan Dr Unit 109
- 17 Morgan Dr Unit 401
- 11 Morgan Dr Unit 404
- 7 Allison Way Unit 7
- 30 Sienna Ln Unit 30
- 1 Fern St
- 6 Hopewell Farm Rd
- 16 Wayside Rd Unit 14
- 28 Sylvester Rd
- 8 Washington St
- 11 Wyndemere Ln
- 17 Wyndemere Ln
- 303 Eliot St
- 5 Farm Rd
- 62 Oakland St
- 137 Lake St
- 216-218 S Main St
- 16 West St
- 79 Speen St
- 14 Pinewood Ave
Your Personal Tour Guide
Ask me questions while you tour the home.