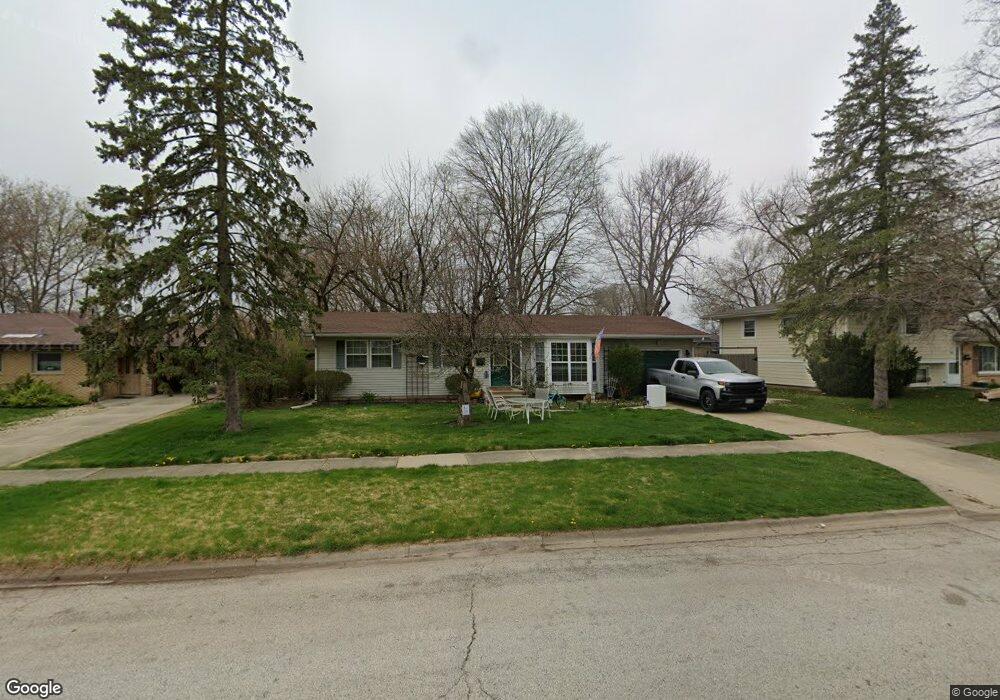
112 N Rosedale Ave Aurora, IL 60506
Edgelawn Randall NeighborhoodEstimated Value: $270,853 - $305,000
3
Beds
1
Bath
1,288
Sq Ft
$225/Sq Ft
Est. Value
About This Home
This home is located at 112 N Rosedale Ave, Aurora, IL 60506 and is currently estimated at $289,963, approximately $225 per square foot. 112 N Rosedale Ave is a home located in Kane County with nearby schools including Mccleery Elementary School, Jefferson Middle School, and West Aurora High School.
Ownership History
Date
Name
Owned For
Owner Type
Purchase Details
Closed on
Oct 2, 2017
Sold by
Sandborn Amy
Bought by
Arias Rigoberto
Current Estimated Value
Home Financials for this Owner
Home Financials are based on the most recent Mortgage that was taken out on this home.
Original Mortgage
$162,950
Outstanding Balance
$135,963
Interest Rate
3.78%
Mortgage Type
New Conventional
Estimated Equity
$154,000
Purchase Details
Closed on
Feb 10, 2005
Sold by
Apel Kenneth C and Apel Nancy J
Bought by
Sanborn Amy
Home Financials for this Owner
Home Financials are based on the most recent Mortgage that was taken out on this home.
Original Mortgage
$81,500
Interest Rate
5.71%
Mortgage Type
Purchase Money Mortgage
Purchase Details
Closed on
Apr 30, 1996
Sold by
Yasneem Mohammad M and Tasneem Yasmin A
Bought by
Apel Kenneth C and Apel Nancy J
Home Financials for this Owner
Home Financials are based on the most recent Mortgage that was taken out on this home.
Original Mortgage
$82,000
Interest Rate
7.86%
Create a Home Valuation Report for This Property
The Home Valuation Report is an in-depth analysis detailing your home's value as well as a comparison with similar homes in the area
Home Values in the Area
Average Home Value in this Area
Purchase History
| Date | Buyer | Sale Price | Title Company |
|---|---|---|---|
| Arias Rigoberto | $168,000 | Chicago Title Insurance Co | |
| Sanborn Amy | $170,000 | Law Title Ins Co | |
| Apel Kenneth C | $91,500 | Law Title Insurance Co Inc |
Source: Public Records
Mortgage History
| Date | Status | Borrower | Loan Amount |
|---|---|---|---|
| Open | Arias Rigoberto | $162,950 | |
| Previous Owner | Sanborn Amy | $81,500 | |
| Previous Owner | Apel Kenneth C | $82,000 |
Source: Public Records
Tax History
| Year | Tax Paid | Tax Assessment Tax Assessment Total Assessment is a certain percentage of the fair market value that is determined by local assessors to be the total taxable value of land and additions on the property. | Land | Improvement |
|---|---|---|---|---|
| 2024 | $5,481 | $77,217 | $13,876 | $63,341 |
| 2023 | $5,224 | $68,993 | $12,398 | $56,595 |
| 2022 | $5,041 | $62,950 | $11,312 | $51,638 |
| 2021 | $4,806 | $58,608 | $10,532 | $48,076 |
| 2020 | $4,535 | $54,438 | $9,783 | $44,655 |
| 2019 | $4,345 | $50,438 | $9,064 | $41,374 |
| 2018 | $3,934 | $45,405 | $8,384 | $37,021 |
| 2017 | $5,596 | $54,370 | $7,725 | $46,645 |
| 2016 | $4,499 | $48,350 | $6,622 | $41,728 |
| 2015 | -- | $42,508 | $5,694 | $36,814 |
| 2014 | -- | $39,567 | $5,233 | $34,334 |
| 2013 | -- | $40,060 | $5,158 | $34,902 |
Source: Public Records
Map
Nearby Homes
- 123 N Rosedale Ave
- 231 W Downer Place
- 140 S Westlawn Ave
- 170 Alschuler Dr
- 1344 W Galena Blvd
- 1615 Heather Dr
- 1421 Heather Dr
- 2140 Sandburg Dr
- 833 N Randall Rd Unit C4
- 220 S Calumet Ave
- 8 S Commonwealth Ave
- 1387 S Glen Cir Unit D
- 1930 Richard St Unit 1
- 1061 S Pleasure Ct
- 1480 Colorado Ave
- 1039 S Pleasure Ct
- 375 S Constitution Dr
- 381 S Constitution Dr
- 1515 Prairie St
- 1086 Cascade Dr Unit 1
- 118 N Rosedale Ave
- 106 N Rosedale Ave
- 1736 Greene Ct
- 124 N Rosedale Ave
- 100 N Rosedale Ave
- 1731 Greene Ct
- 111 N Rosedale Ave
- 215 N Edgelawn Dr Unit 3
- 204 N Rosedale Ave
- 205 N Edgelawn Dr
- 22 N Rosedale Ave
- 219 N Edgelawn Dr
- 61 N Rosedale Ave
- 115 N Rosedale Ave
- 15 N Edgelawn Dr
- 1735 Greene Ct Unit B
- 1735 Greene Ct Unit C
- 1735 Greene Ct Unit A
- 101 N Rosedale Ave Unit 1
- 212 N Rosedale Ave
Your Personal Tour Guide
Ask me questions while you tour the home.