112 N Thompson Ct Mobile, AL 36611
Estimated Value: $52,000 - $77,000
2
Beds
1
Bath
840
Sq Ft
$73/Sq Ft
Est. Value
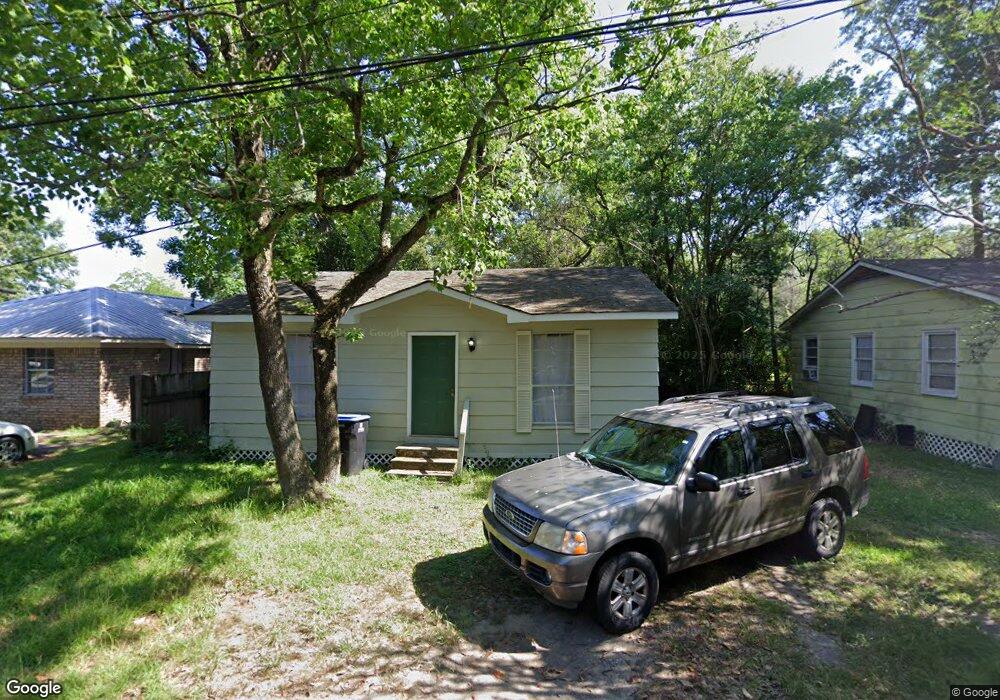
About This Home
This home is located at 112 N Thompson Ct, Mobile, AL 36611 and is currently estimated at $61,453, approximately $73 per square foot. 112 N Thompson Ct is a home located in Mobile County with nearby schools including Chickasaw City Elementary School, Chickasaw City High School, and Prichard Preparatory School.
Ownership History
Date
Name
Owned For
Owner Type
Purchase Details
Closed on
May 5, 2023
Sold by
B Sr P Investment Properties Llc
Bought by
Dunnavant Properties Llc
Current Estimated Value
Home Financials for this Owner
Home Financials are based on the most recent Mortgage that was taken out on this home.
Original Mortgage
$44,200
Outstanding Balance
$42,978
Interest Rate
6.42%
Mortgage Type
Credit Line Revolving
Estimated Equity
$18,475
Purchase Details
Closed on
Oct 6, 2021
Sold by
Greer Joseph Barton
Bought by
B & P Investment Properties Llc
Purchase Details
Closed on
Feb 22, 2021
Sold by
Carmichael Faye and Fleming Yvonne C
Bought by
Greer Joseph Barton
Create a Home Valuation Report for This Property
The Home Valuation Report is an in-depth analysis detailing your home's value as well as a comparison with similar homes in the area
Home Values in the Area
Average Home Value in this Area
Purchase History
| Date | Buyer | Sale Price | Title Company |
|---|---|---|---|
| Dunnavant Properties Llc | $52,000 | None Listed On Document | |
| B & P Investment Properties Llc | $650,000 | None Available | |
| Greer Joseph Barton | $14,000 | None Available |
Source: Public Records
Mortgage History
| Date | Status | Borrower | Loan Amount |
|---|---|---|---|
| Open | Dunnavant Properties Llc | $44,200 |
Source: Public Records
Tax History Compared to Growth
Tax History
| Year | Tax Paid | Tax Assessment Tax Assessment Total Assessment is a certain percentage of the fair market value that is determined by local assessors to be the total taxable value of land and additions on the property. | Land | Improvement |
|---|---|---|---|---|
| 2024 | $115 | $1,960 | $600 | $1,360 |
| 2023 | $115 | $3,460 | $1,200 | $2,260 |
| 2022 | $174 | $3,260 | $1,200 | $2,060 |
| 2021 | $308 | $5,760 | $1,100 | $4,660 |
| 2020 | $308 | $5,760 | $1,100 | $4,660 |
| 2019 | $294 | $5,500 | $1,120 | $4,380 |
| 2018 | $291 | $5,440 | $0 | $0 |
| 2017 | $288 | $5,440 | $0 | $0 |
| 2016 | $455 | $8,580 | $0 | $0 |
| 2013 | $704 | $12,320 | $0 | $0 |
Source: Public Records
Map
Nearby Homes