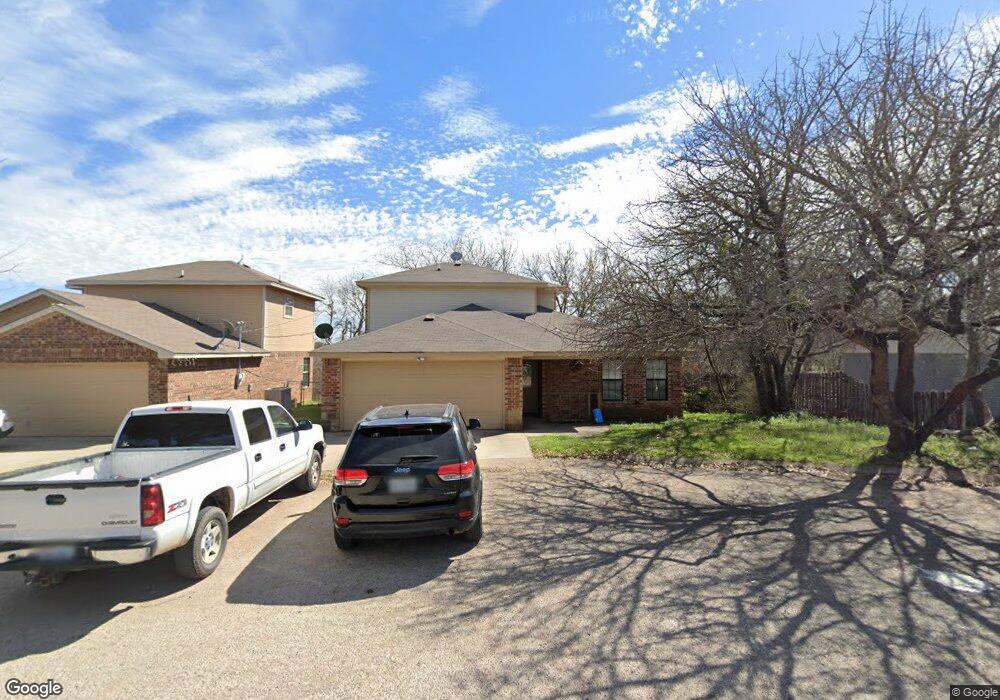
112 Oak Ridge Terrace Weatherford, TX 76086
Estimated Value: $250,834 - $295,000
--
Bed
--
Bath
1,408
Sq Ft
$192/Sq Ft
Est. Value
About This Home
This home is located at 112 Oak Ridge Terrace, Weatherford, TX 76086 and is currently estimated at $270,209, approximately $191 per square foot. 112 Oak Ridge Terrace is a home located in Parker County with nearby schools including Curtis Elementary School, Hall Middle School, and Weatherford High School.
Ownership History
Date
Name
Owned For
Owner Type
Purchase Details
Closed on
Jul 9, 2008
Sold by
Rapkoch Properties Lp
Bought by
Rural Financial Services
Current Estimated Value
Purchase Details
Closed on
Mar 21, 2005
Sold by
J&J Homes Corporation
Bought by
Rural Financial Services
Home Financials for this Owner
Home Financials are based on the most recent Mortgage that was taken out on this home.
Original Mortgage
$170,000
Interest Rate
5.22%
Mortgage Type
Purchase Money Mortgage
Purchase Details
Closed on
Aug 6, 2003
Sold by
Dos Wiggs Corp
Bought by
Rural Financial Services
Purchase Details
Closed on
Apr 11, 2002
Sold by
Jeanne Betzel W and Jeanne Potthoff J
Bought by
Rural Financial Services
Purchase Details
Closed on
May 2, 1995
Bought by
Rural Financial Services
Purchase Details
Closed on
Aug 11, 1986
Bought by
Rural Financial Services
Create a Home Valuation Report for This Property
The Home Valuation Report is an in-depth analysis detailing your home's value as well as a comparison with similar homes in the area
Home Values in the Area
Average Home Value in this Area
Purchase History
| Date | Buyer | Sale Price | Title Company |
|---|---|---|---|
| Rural Financial Services | -- | -- | |
| Rural Financial Services | -- | -- | |
| Rural Financial Services | -- | -- | |
| Rural Financial Services | -- | -- | |
| Rural Financial Services | -- | -- | |
| Rural Financial Services | -- | -- |
Source: Public Records
Mortgage History
| Date | Status | Borrower | Loan Amount |
|---|---|---|---|
| Previous Owner | Rural Financial Services | $170,000 |
Source: Public Records
Tax History Compared to Growth
Tax History
| Year | Tax Paid | Tax Assessment Tax Assessment Total Assessment is a certain percentage of the fair market value that is determined by local assessors to be the total taxable value of land and additions on the property. | Land | Improvement |
|---|---|---|---|---|
| 2025 | $4,906 | $260,480 | $50,000 | $210,480 |
| 2024 | $4,906 | $254,550 | $40,000 | $214,550 |
| 2023 | $4,906 | $254,550 | $40,000 | $214,550 |
| 2022 | $4,041 | $182,200 | $20,000 | $162,200 |
| 2021 | $4,375 | $182,200 | $20,000 | $162,200 |
| 2020 | $3,889 | $160,940 | $20,000 | $140,940 |
| 2019 | $4,110 | $160,940 | $20,000 | $140,940 |
| 2018 | $3,347 | $130,480 | $20,000 | $110,480 |
| 2017 | $3,433 | $130,480 | $20,000 | $110,480 |
| 2016 | $2,906 | $110,450 | $20,000 | $90,450 |
| 2015 | $2,846 | $110,450 | $20,000 | $90,450 |
| 2014 | $2,735 | $108,900 | $20,000 | $88,900 |
Source: Public Records
Map
Nearby Homes
- 209 S Hill Dr
- 1213 S Lamar St
- 1220 S Brazos St
- 423 Live Oak Ln
- 323 W Rentz St
- 102 Bob White Ave
- 1009 S Brazos St
- 208 W Park Ave
- 905 S Lamar St
- 904 S Brazos St
- 918 El Dorado St
- 905 Eldorado St
- 122 Rachel Rd
- 824 S Alamo St
- 902 S Waco St
- 819 Norton St
- 213 Jefferson St
- 221 Jefferson St
- 208 Jefferson St
- 237 Jefferson St
- 112 Oak Ridge Terrace
- 110 Oak Ridge Terrace
- 114 Oak Ridge Terrace
- 108 Oak Ridge Terrace
- 207 S Hill Dr
- 117 Oak Ridge Terrace
- 106 Oak Ridge Terrace
- 213 S Hill Dr
- 121 Oak Ridge Terrace
- 119 Oak Ridge Terrace
- 205 S Hill Dr
- 111 Oak Ridge Terrace
- 104 Oak Ridge Terrace
- 221 Live Oak Ln
- 305 Live Oak Ln
- 109 Oak Ridge Terrace
- 1222 S Lamar St
- 203 S Hill Dr
- 107 Oak Ridge Terrace
- 108 W Ridge Rd