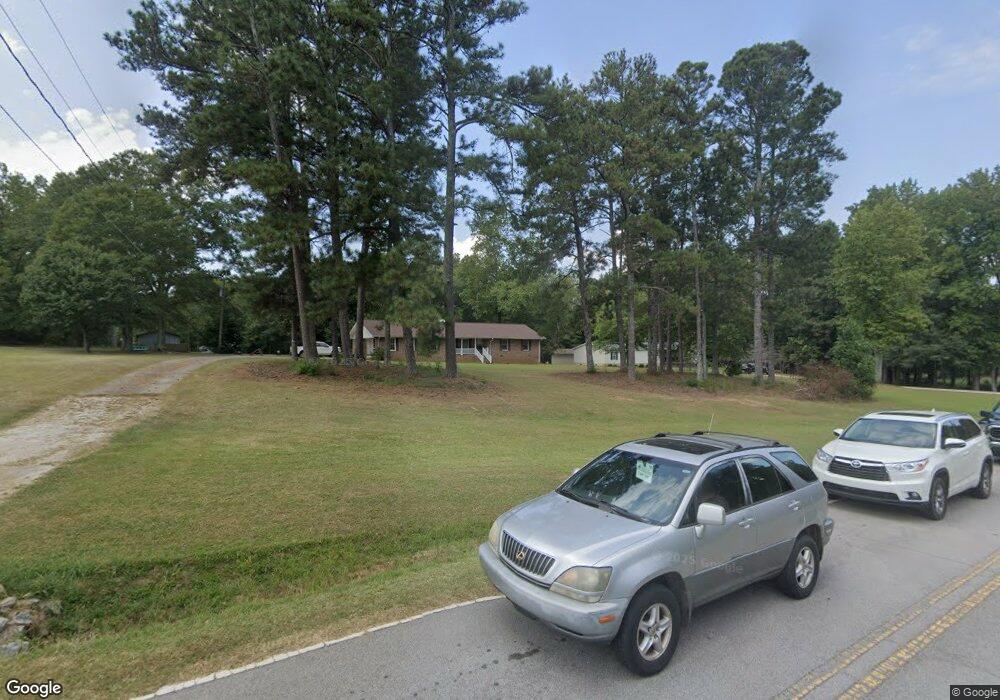
112 Old Carrollton Rd Roopville, GA 30170
Estimated Value: $298,000 - $469,000
3
Beds
2
Baths
2,206
Sq Ft
$177/Sq Ft
Est. Value
About This Home
This home is located at 112 Old Carrollton Rd, Roopville, GA 30170 and is currently estimated at $390,056, approximately $176 per square foot. 112 Old Carrollton Rd is a home located in Carroll County with nearby schools including Roopville Elementary School, Central Middle School, and Central High School.
Ownership History
Date
Name
Owned For
Owner Type
Purchase Details
Closed on
Jan 29, 2021
Sold by
Webster Deborah Louise Estate
Bought by
Webster John Byron
Current Estimated Value
Purchase Details
Closed on
Jan 24, 2021
Sold by
Webster Deborah Louise Estate
Bought by
Webster John Byron
Purchase Details
Closed on
Feb 1, 2011
Sold by
Webster John Byron
Bought by
Webster Deborah Louise
Purchase Details
Closed on
May 8, 2002
Sold by
Community First Bank
Bought by
Sims Sims J and Sims Pauline B
Purchase Details
Closed on
Apr 25, 2002
Sold by
Sims Sims J and Sims Pauline B
Bought by
Webster John B and Webster Deeanca
Purchase Details
Closed on
Oct 19, 1998
Sold by
Rooks Sd Est
Bought by
Sims Sims J and Sims Pauline B
Purchase Details
Closed on
Jun 1, 1973
Bought by
Rooks
Create a Home Valuation Report for This Property
The Home Valuation Report is an in-depth analysis detailing your home's value as well as a comparison with similar homes in the area
Home Values in the Area
Average Home Value in this Area
Purchase History
| Date | Buyer | Sale Price | Title Company |
|---|---|---|---|
| Webster John Byron | -- | -- | |
| Webster John Byron | -- | -- | |
| Webster Deborah Louise | $140,152 | -- | |
| Sims Sims J | -- | -- | |
| Webster John B | $137,000 | -- | |
| Sims Sims J | $135,000 | -- | |
| Rooks | -- | -- |
Source: Public Records
Tax History Compared to Growth
Tax History
| Year | Tax Paid | Tax Assessment Tax Assessment Total Assessment is a certain percentage of the fair market value that is determined by local assessors to be the total taxable value of land and additions on the property. | Land | Improvement |
|---|---|---|---|---|
| 2024 | $2,703 | $119,506 | $28,601 | $90,905 |
| 2023 | $2,703 | $105,491 | $22,881 | $82,610 |
| 2022 | $2,045 | $81,554 | $15,254 | $66,300 |
| 2021 | $1,769 | $69,006 | $12,203 | $56,803 |
| 2020 | $336 | $62,076 | $11,094 | $50,982 |
| 2019 | $1,336 | $57,310 | $11,094 | $46,216 |
| 2018 | $1,250 | $51,593 | $10,368 | $41,225 |
| 2017 | $1,254 | $51,593 | $10,368 | $41,225 |
| 2016 | $1,254 | $51,593 | $10,368 | $41,225 |
| 2015 | $1,332 | $51,622 | $12,314 | $39,309 |
| 2014 | $1,338 | $51,623 | $12,314 | $39,309 |
Source: Public Records
Map
Nearby Homes
- 0 W Highway 5 Unit 10519663
- 1280 Us Highway 27
- 178 S Old Highway 27
- 301 E Highway 5
- 273 Old 27 Hwy
- 305 West Dr
- 1949 Roopville Veal Rd Unit 11
- 1949 Roopville Veal Rd
- 0 Roopville Veal Rd Unit 120 148246
- 0 Roopville Veal Rd Unit 10610800
- 191 Tumlin Creek Rd
- 0 Louise Ln Unit 10563364
- 67 Glenloch Rd
- 534 Craven Rd
- 534 Craven Rd Unit 137
- 558 Craven Rd
- 537 Craven Rd
- 0 Needmore Road- (345 37 Acres)
- 115 Nugget Rd
- 484 Lepard Rd
- 0 Old Carrollton Rd Unit 8227037
- 150 Old Carrollton Rd
- 155 Old Carrollton Rd
- 90 N Old Highway 27
- 108 Old Highway 27 S
- 90 Old Highway 27 N
- 40 Old Carrollton Rd
- 108 N Old Highway 27
- 42 N Old Highway 27
- 187 Old Carrollton Rd
- 124 N Old Highway 27
- N Old Highway 27 N
- 264 Old Carrollton Rd
- 144 N Old Highway 27
- 53 Georgia 5
- 53 W Highway 5
- 37 N Highway 27
- 0 W Highway 5
- 0 W Highway 5 Unit 3188241
- 0 W Highway 5 Unit 20147199