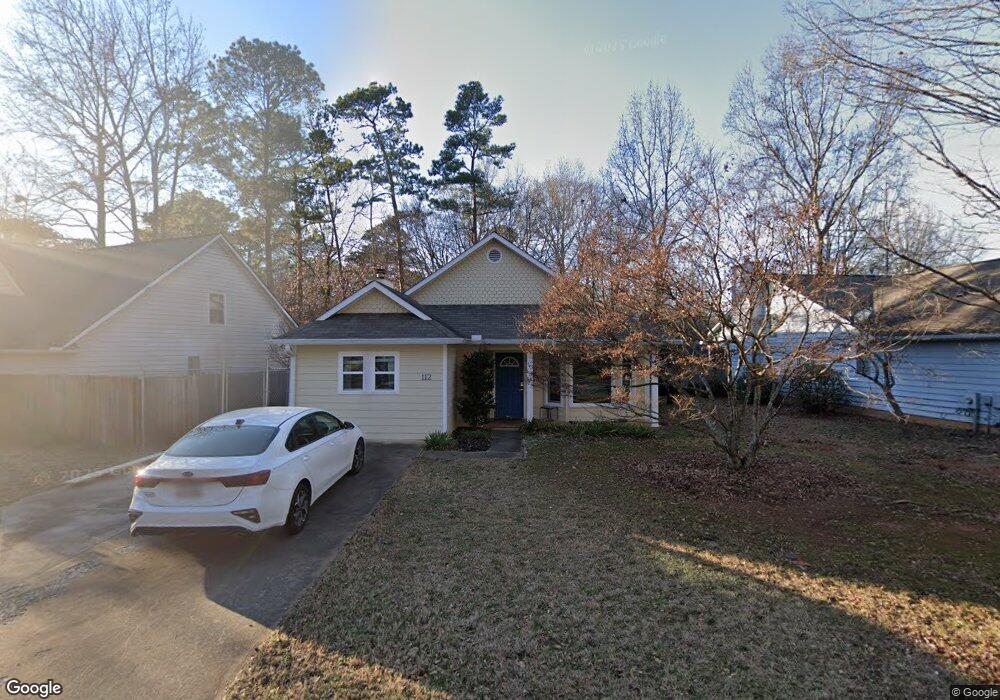
112 Onyx Place Athens, GA 30605
Estimated Value: $277,000 - $294,000
2
Beds
2
Baths
1,275
Sq Ft
$222/Sq Ft
Est. Value
About This Home
This home is located at 112 Onyx Place, Athens, GA 30605 and is currently estimated at $283,166, approximately $222 per square foot. 112 Onyx Place is a home located in Clarke County with nearby schools including Barnett Shoals Elementary School, Hilsman Middle School, and Cedar Shoals High School.
Ownership History
Date
Name
Owned For
Owner Type
Purchase Details
Closed on
Sep 3, 2021
Sold by
Dallas Sally L
Bought by
Karen May Holmgren Trust
Current Estimated Value
Home Financials for this Owner
Home Financials are based on the most recent Mortgage that was taken out on this home.
Original Mortgage
$307,500
Outstanding Balance
$301,494
Interest Rate
2.7%
Mortgage Type
FHA
Estimated Equity
-$18,328
Purchase Details
Closed on
Aug 16, 2013
Sold by
Anglin John William
Bought by
Dallas Sally L
Purchase Details
Closed on
Apr 6, 2004
Sold by
Patat Fred Clay
Bought by
Anglin John William and Alison Patric
Purchase Details
Closed on
May 31, 2000
Sold by
Youngner Susan M
Bought by
Patat Fred Clay
Purchase Details
Closed on
Mar 9, 1994
Sold by
Sligh Robert L
Bought by
Youngner Susan M
Purchase Details
Closed on
Jun 28, 1991
Sold by
North Carlton R and Ross Michael J
Bought by
Sligh Robert L
Create a Home Valuation Report for This Property
The Home Valuation Report is an in-depth analysis detailing your home's value as well as a comparison with similar homes in the area
Home Values in the Area
Average Home Value in this Area
Purchase History
| Date | Buyer | Sale Price | Title Company |
|---|---|---|---|
| Karen May Holmgren Trust | $205,000 | -- | |
| Dallas Sally L | $88,500 | -- | |
| Anglin John William | $112,000 | -- | |
| Patat Fred Clay | $91,700 | -- | |
| Youngner Susan M | $68,000 | -- | |
| Sligh Robert L | $65,000 | -- |
Source: Public Records
Mortgage History
| Date | Status | Borrower | Loan Amount |
|---|---|---|---|
| Open | Karen May Holmgren Trust | $307,500 |
Source: Public Records
Tax History Compared to Growth
Tax History
| Year | Tax Paid | Tax Assessment Tax Assessment Total Assessment is a certain percentage of the fair market value that is determined by local assessors to be the total taxable value of land and additions on the property. | Land | Improvement |
|---|---|---|---|---|
| 2024 | $1,874 | $104,401 | $12,000 | $92,401 |
| 2023 | $716 | $96,412 | $12,000 | $84,412 |
| 2022 | $1,833 | $81,179 | $10,400 | $70,779 |
| 2021 | $1,952 | $57,922 | $8,050 | $49,872 |
| 2020 | $1,952 | $57,922 | $8,800 | $49,122 |
| 2019 | $1,798 | $52,959 | $8,800 | $44,159 |
| 2018 | $1,658 | $48,836 | $8,800 | $40,036 |
| 2017 | $1,502 | $44,230 | $8,800 | $35,430 |
| 2016 | $1,397 | $41,159 | $8,800 | $32,359 |
| 2015 | $1,349 | $39,684 | $8,800 | $30,884 |
| 2014 | $1,205 | $39,865 | $8,800 | $31,065 |
Source: Public Records
Map
Nearby Homes
- 112 Onyx Place
- 118 Onyx Place
- 106 Onyx Place
- 0 Onyx Place Unit 8478972
- 0 Onyx Place Unit 8371972
- 0 Onyx Place Unit 7577862
- 102 Onyx Place
- 112 Sapphire Ct
- 114 Sapphire Ct
- 110 Sapphire Ct
- 116 Sapphire Ct
- 105 Onyx Place
- 109 Onyx Place
- 115 Onyx Place
- 125 Diamond Dr
- 125 Diamond Dr
- 121 Onyx Place
- 103 Onyx Place
- 123 Onyx Place
- 131 Diamond Dr