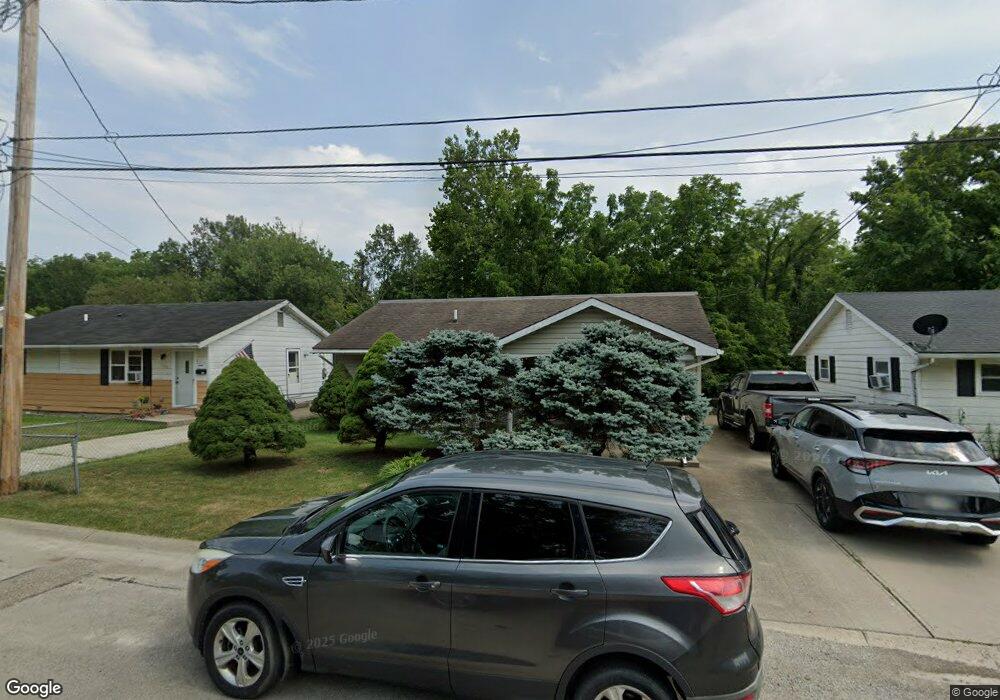
112 Orchard View Ln Blanchester, OH 45107
Estimated Value: $180,569 - $226,000
3
Beds
1
Bath
1,368
Sq Ft
$149/Sq Ft
Est. Value
About This Home
This home is located at 112 Orchard View Ln, Blanchester, OH 45107 and is currently estimated at $203,892, approximately $149 per square foot. 112 Orchard View Ln is a home located in Clinton County with nearby schools including Cross Roads Elementary School, Putman Elementary School, and Blanchester Middle School.
Ownership History
Date
Name
Owned For
Owner Type
Purchase Details
Closed on
Nov 28, 2003
Sold by
Burchett Fred E and Burchett Linda Kay
Bought by
Lynch Kelly R and Lynch Ii Thomas R
Current Estimated Value
Home Financials for this Owner
Home Financials are based on the most recent Mortgage that was taken out on this home.
Original Mortgage
$71,250
Outstanding Balance
$32,930
Interest Rate
6.07%
Mortgage Type
Purchase Money Mortgage
Estimated Equity
$170,962
Purchase Details
Closed on
Oct 23, 2003
Sold by
Burchett Fred E and Burchett Linda Kay
Bought by
Lynch Ii Thomas R and Lynch Kelly R
Home Financials for this Owner
Home Financials are based on the most recent Mortgage that was taken out on this home.
Original Mortgage
$71,250
Outstanding Balance
$32,930
Interest Rate
6.07%
Mortgage Type
Purchase Money Mortgage
Estimated Equity
$170,962
Purchase Details
Closed on
Jan 1, 1990
Bought by
Burchett Fred E
Create a Home Valuation Report for This Property
The Home Valuation Report is an in-depth analysis detailing your home's value as well as a comparison with similar homes in the area
Home Values in the Area
Average Home Value in this Area
Purchase History
| Date | Buyer | Sale Price | Title Company |
|---|---|---|---|
| Lynch Kelly R | $75,000 | -- | |
| Lynch Ii Thomas R | $75,000 | Superior Title Agency Inc | |
| Burchett Fred E | -- | -- |
Source: Public Records
Mortgage History
| Date | Status | Borrower | Loan Amount |
|---|---|---|---|
| Open | Lynch Ii Thomas R | $71,250 |
Source: Public Records
Tax History Compared to Growth
Tax History
| Year | Tax Paid | Tax Assessment Tax Assessment Total Assessment is a certain percentage of the fair market value that is determined by local assessors to be the total taxable value of land and additions on the property. | Land | Improvement |
|---|---|---|---|---|
| 2024 | $1,737 | $46,410 | $3,920 | $42,490 |
| 2023 | $1,737 | $46,410 | $3,920 | $42,490 |
| 2022 | $1,383 | $33,470 | $3,390 | $30,080 |
| 2021 | $1,450 | $33,470 | $3,390 | $30,080 |
| 2020 | $1,445 | $33,470 | $3,390 | $30,080 |
| 2019 | $1,176 | $26,410 | $3,380 | $23,030 |
| 2018 | $1,181 | $26,410 | $3,380 | $23,030 |
| 2017 | $578 | $26,410 | $3,380 | $23,030 |
| 2016 | $965 | $23,090 | $3,380 | $19,710 |
| 2015 | $965 | $23,090 | $3,380 | $19,710 |
| 2013 | $953 | $22,140 | $3,380 | $18,760 |
Source: Public Records
Map
Nearby Homes
- 401 N Wright St
- 409 N Broadway St
- 213 N Broadway St
- 157 Pansy Pike
- 112 Willow Place
- 477 N Columbus St
- 301 W Main St
- 169 Pansy Pike
- 9 Pansy Pike
- 217 Pansy Pike
- 11 Pansy Pike
- 12 Pansy Pike
- 10 Pansy Pike
- 502 Railroad St
- 504 Cherry St
- 305 W Main St
- 221 S Vine St
- 107 Central Ave
- 503 S Broadway St
- 1432 State Route 28
- 110 Orchard View Ln
- 114 Orchard View Ln
- 108 Orchard View Ln
- 116 Orchard View Ln
- 18 Orchard Cir
- 118 Orchard View Ln
- 106 Orchard View Ln
- 25 Orchard Cir
- 104 Orchard View Ln
- 408 N Wright St
- 109 Orchard View Ln
- 120 Orchard View Ln
- 16 Orchard Cir
- 35 Orchard Cir
- 122 Orchard View Ln
- 26 Orchard Cir
- 506 N Broadway St
- 502 N Broadway St
- 124 Orchard View Ln
- 45 Orchard Cir