B
Seller's Agent in 2019
Bruce Haslehurst
Proactive Realty
(508) 222-6385
28 Total Sales


Estimated Value: $328,000 - $413,000
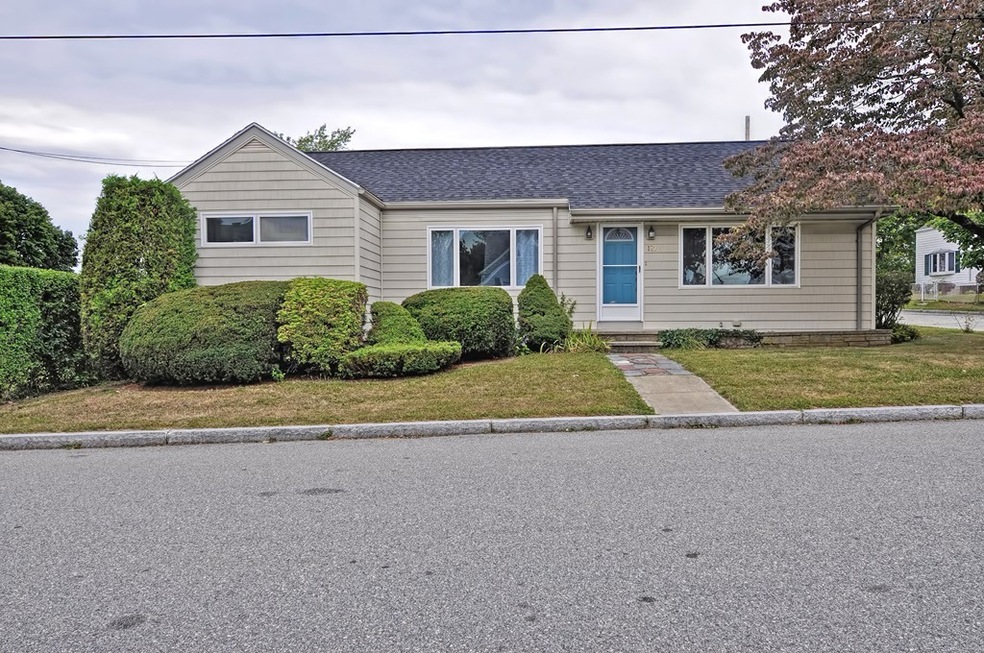
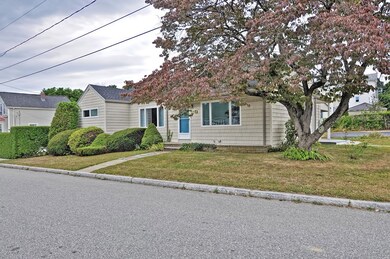
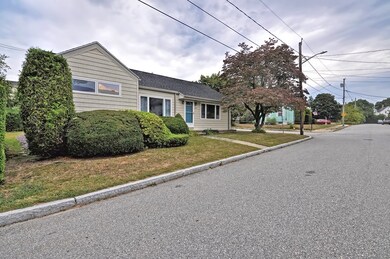
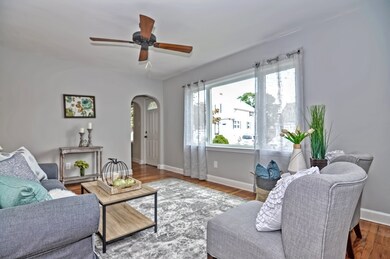
BACK ON THE MARKET SO DON'T MISS ANOTHER CHANCE TO BUY A GREAT PROPERTY!!! CHECK OUT THIS 3 BEDROOM HOUSE ON A QUIET DEAD END STREET!! This is a great opportunity to own a fully renovated 3 bedroom Ranch that is close to highways, shopping, restaurants, schools, public transportation, and parks. Interior updates include new kitchen cabinets and granite counter tops, brand new stainless steel appliances, updated bath, beautiful hardwood floors throughout, new wall to wall carpeting, and freshly painted interior. Other updates include a new roof, hot water heater and paved driveway just installed. Nothing to do but move right in! ****SELLER TO PAY HOME WARRANTY FOR ONE YEAR IF SALE IS CLOSED WITHIN 30 DAYS OF ACCEPTED OFFER****
| Date | Event | Price | List to Sale | Price per Sq Ft |
|---|---|---|---|---|
| 12/05/2019 12/05/19 | Sold | $245,000 | +2.1% | $207 / Sq Ft |
| 10/04/2019 10/04/19 | Pending | -- | -- | -- |
| 10/02/2019 10/02/19 | For Sale | $239,900 | 0.0% | $203 / Sq Ft |
| 09/17/2019 09/17/19 | Pending | -- | -- | -- |
| 09/12/2019 09/12/19 | For Sale | $239,900 | -- | $203 / Sq Ft |
| Year | Tax Paid | Tax Assessment Tax Assessment Total Assessment is a certain percentage of the fair market value that is determined by local assessors to be the total taxable value of land and additions on the property. | Land | Improvement |
|---|---|---|---|---|
| 2025 | $4,025 | $351,500 | $125,500 | $226,000 |
| 2024 | $3,772 | $328,300 | $120,700 | $207,600 |
| 2023 | $3,606 | $293,900 | $103,500 | $190,400 |
| 2022 | $3,136 | $248,500 | $94,100 | $154,400 |
| 2021 | $2,975 | $215,100 | $87,000 | $128,100 |
| 2020 | $2,789 | $193,000 | $83,300 | $109,700 |
| 2019 | $2,608 | $178,900 | $79,300 | $99,600 |
| 2018 | $2,485 | $170,000 | $77,900 | $92,100 |
| 2017 | $2,379 | $169,900 | $79,500 | $90,400 |
| 2016 | $2,295 | $168,400 | $82,700 | $85,700 |
| 2015 | $2,090 | $159,800 | $79,700 | $80,100 |
| 2014 | $2,063 | $164,000 | $83,900 | $80,100 |
B
Seller's Agent in 2019
Bruce Haslehurst
Proactive Realty
(508) 222-6385
28 Total Sales
Source: MLS Property Information Network (MLS PIN)
MLS Number: 72564143
APN: FALL-000002E-000000-000017
Disclaimer: Certain information contained herein is derived from information provided by parties other than Homes.com. All information provided is deemed reliable, but is not guaranteed to be accurate and should be independently verified.
![]() The property listing data and information, or the Images, set forth herein were provided to MLS Property Information Network, Inc. from third party sources, including sellers, lessors and public records, and were compiled by MLS Property Information Network, Inc. The property listing data and information, and the Images, are for the personal, non-commercial use of consumers having a good faith interest in purchasing or leasing listed properties of the type displayed to them and may not be used for any purpose other than to identify prospective properties which such consumers may have a good faith interest in purchasing or leasing. MLS Property Information Network, Inc. and its subscribers disclaim any and all representations and warranties as to the accuracy of the property listing data and information, or as to the accuracy of any of the Images, set forth herein.
The property listing data and information, or the Images, set forth herein were provided to MLS Property Information Network, Inc. from third party sources, including sellers, lessors and public records, and were compiled by MLS Property Information Network, Inc. The property listing data and information, and the Images, are for the personal, non-commercial use of consumers having a good faith interest in purchasing or leasing listed properties of the type displayed to them and may not be used for any purpose other than to identify prospective properties which such consumers may have a good faith interest in purchasing or leasing. MLS Property Information Network, Inc. and its subscribers disclaim any and all representations and warranties as to the accuracy of the property listing data and information, or as to the accuracy of any of the Images, set forth herein.
Ask me questions while you tour the home.
