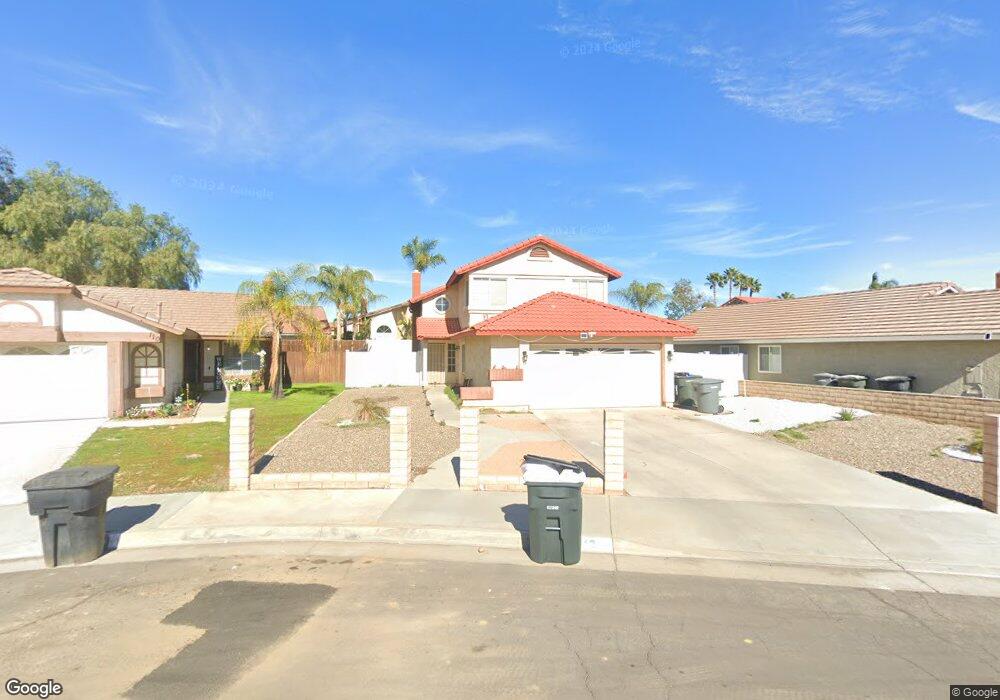
112 Peppertree Dr Perris, CA 92571
Central Perris NeighborhoodEstimated Value: $472,000 - $499,478
About This Home
This home is located at 112 Peppertree Dr, Perris, CA 92571 and is currently estimated at $485,620, approximately $332 per square foot. 112 Peppertree Dr is a home located in Riverside County with nearby schools including Palms Elementary School, Pinacate Middle School, and Perris High School.
Ownership History
We collect this data history from publicly available records. To have your information removed, we recommend requesting removal directly through your county’s website.
Purchase Details
Purchase Details
Home Financials for this Owner
Home Financials are based on the most recent Mortgage that was taken out on this home.Purchase Details
Home Financials for this Owner
Home Financials are based on the most recent Mortgage that was taken out on this home.Purchase Details
Home Financials for this Owner
Home Financials are based on the most recent Mortgage that was taken out on this home.Purchase Details
Home Financials for this Owner
Home Financials are based on the most recent Mortgage that was taken out on this home.Purchase Details
Home Financials for this Owner
Home Financials are based on the most recent Mortgage that was taken out on this home.Purchase Details
Home Financials for this Owner
Home Financials are based on the most recent Mortgage that was taken out on this home.Purchase Details
Purchase Details
Purchase Details
Home Financials for this Owner
Home Financials are based on the most recent Mortgage that was taken out on this home.Purchase Details
Home Financials for this Owner
Home Financials are based on the most recent Mortgage that was taken out on this home.Purchase Details
Purchase Details
Purchase Details
Purchase Details
Purchase Details
Home Financials for this Owner
Home Financials are based on the most recent Mortgage that was taken out on this home.Purchase Details
Purchase Details
Home Values in the Area
Average Home Value in this Area
Purchase History
We collect this data history from publicly available records. To have your information removed, we recommend requesting removal directly through your county’s website.
| Date | Buyer | Sale Price | Title Company |
|---|---|---|---|
| -- | None Available | ||
| $111,000 | Ticor Title Company | ||
| -- | Ticor Title Company | ||
| -- | Orange Coast Title Co | ||
| $260,000 | -- | ||
| -- | Lawyers Title Company | ||
| $78,000 | Lawyers Title Company | ||
| $99,366 | Fidelity National Title Ins | ||
| $99,366 | Fidelity National Title Ins | ||
| $92,000 | Stewart Title | ||
| $65,000 | First American Title Ins Co | ||
| $84,744 | Landsafe Title | ||
| -- | -- | ||
| -- | -- | ||
| -- | First Southwestern Title Co | ||
| $80,500 | First Southwestern Title Co | ||
| $92,625 | Union Land Title Company | ||
| -- | Union Land Title Company |
Mortgage History
We collect this data history from publicly available records. To have your information removed, we recommend requesting removal directly through your county’s website.
| Date | Status | Borrower | Loan Amount |
|---|---|---|---|
| Open | $109,525 | ||
| Previous Owner | $208,000 | ||
| Previous Owner | $88,500 | ||
| Previous Owner | $83,250 | ||
| Previous Owner | $92,687 | ||
| Previous Owner | $48,750 | ||
| Previous Owner | $78,630 | ||
| Closed | $52,000 |
Tax History
We collect this data history from publicly available records. To have your information removed, we recommend requesting removal directly through your county’s website.
| Year | Tax Paid | Tax Assessment Tax Assessment Total Assessment is a certain percentage of the fair market value that is determined by local assessors to be the total taxable value of land and additions on the property. | Land | Improvement |
|---|---|---|---|---|
| 2025 | $3,095 | $278,534 | $46,420 | $232,114 |
| 2023 | $3,095 | $267,719 | $44,618 | $223,101 |
| 2022 | $3,059 | $262,471 | $43,744 | $218,727 |
| 2021 | $2,999 | $257,326 | $42,887 | $214,439 |
| 2020 | $2,961 | $254,689 | $42,448 | $212,241 |
| 2019 | $2,892 | $249,696 | $41,616 | $208,080 |
| 2018 | $2,761 | $244,800 | $40,800 | $204,000 |
| 2017 | $1,481 | $123,446 | $27,800 | $95,646 |
| 2016 | $1,452 | $121,026 | $27,255 | $93,771 |
| 2015 | $1,425 | $119,210 | $26,847 | $92,363 |
| 2014 | $1,393 | $116,876 | $26,322 | $90,554 |
Map
- 129 Olivetree Dr
- 1659 Ruby Dr
- 2248 Ridge Ct
- 285 Flicker Way
- 2242 Autumn Ct
- 1255 Comiskey Ct
- 192 E Bowen Rd
- 0 W Bowen Rd
- 507 Coudures Way
- 24001 Nuevo Rd
- 24001 -24002 Nuevo Rd
- 24003 Nuevo Rd
- 24002 Nuevo Rd
- 21500 Orange Creek Rd
- 154 Ambrosia Ct
- 560 Coudures Way
- 452 Cherry Vista Dr
- 338 Mildred St
- 1529 Apple Creek Dr
- 1025 Davids Rd
- 1828 Springtree Dr
- 1826 Springtree Dr
- 1830 Springtree Dr
- 114 Peppertree Dr
- 1832 Springtree Dr
- 1824 Springtree Dr
- 111 Orangetree Dr
- 1834 Springtree Dr
- 15 Pepper Dr
- 13 Pepper Dr
- 11 Pepper Dr
- 25 Pepper Dr
- 109 Orangetree Dr
- 122 Peppertree Dr
- 1831 Springtree Dr
- 110 Peppertree Dr
- 1835 Springtree Dr
- 14 Pepper Dr
- 26 Pepper Dr
- 107 Orangetree Dr
Ask me questions while you tour the home.