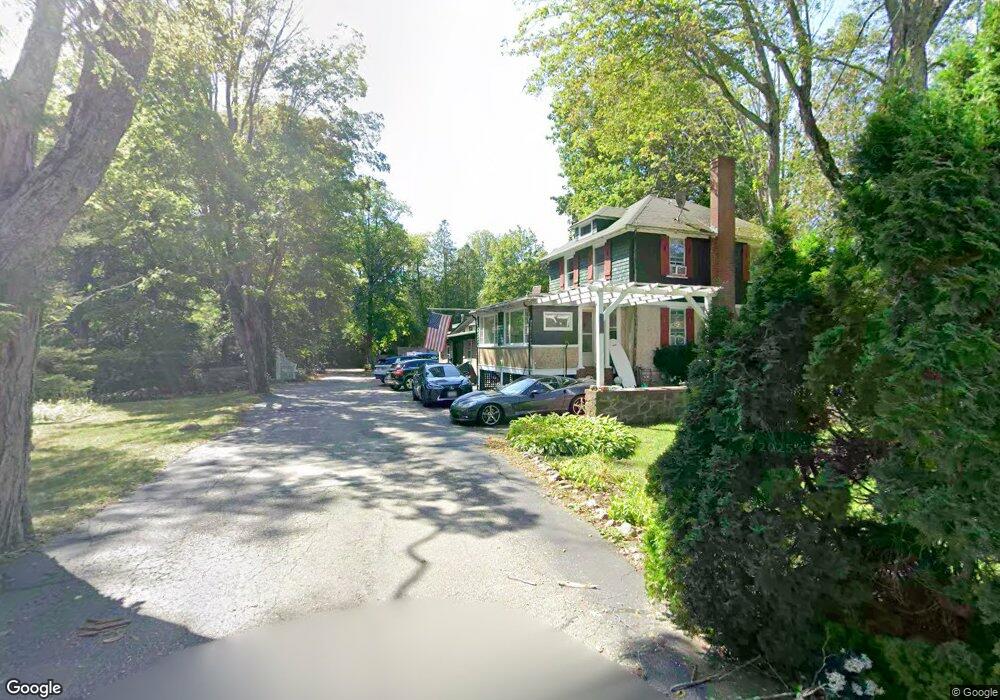
112 Pine St Manchester, MA 01944
Estimated Value: $906,425
Studio
1
Bath
--
Sq Ft
21,519
Sq Ft Lot
About This Home
This home is located at 112 Pine St, Manchester, MA 01944 and is currently priced at $906,425. 112 Pine St is a home located in Essex County.
Ownership History
Date
Name
Owned For
Owner Type
Purchase Details
Closed on
Oct 15, 2020
Sold by
Single Malt Llc
Bought by
112 Pine Street Llc
Current Estimated Value
Home Financials for this Owner
Home Financials are based on the most recent Mortgage that was taken out on this home.
Original Mortgage
$520,000
Outstanding Balance
$459,548
Interest Rate
2.8%
Mortgage Type
Commercial
Estimated Equity
$446,877
Purchase Details
Closed on
Jan 25, 1993
Sold by
Old Stone Bk Californi
Bought by
Cimon Diane P
Purchase Details
Closed on
Dec 8, 1992
Sold by
Maceachern Michael D
Bought by
Old Stone Bank Of Cali
Purchase Details
Closed on
Aug 23, 1990
Sold by
Harnden William A
Bought by
Singleton David R
Create a Home Valuation Report for This Property
The Home Valuation Report is an in-depth analysis detailing your home's value as well as a comparison with similar homes in the area
Home Values in the Area
Average Home Value in this Area
Purchase History
| Date | Buyer | Sale Price | Title Company |
|---|---|---|---|
| 112 Pine Street Llc | $650,000 | None Available | |
| Cimon Diane P | $50,000 | -- | |
| Cimon Diane P | $50,000 | -- | |
| Old Stone Bank Of Cali | $80,000 | -- | |
| Old Stone Bank Of Cali | $80,000 | -- | |
| Singleton David R | $176,000 | -- |
Source: Public Records
Mortgage History
| Date | Status | Borrower | Loan Amount |
|---|---|---|---|
| Open | 112 Pine Street Llc | $520,000 | |
| Previous Owner | Singleton David R | $25,000 | |
| Previous Owner | Singleton David R | $42,802 |
Source: Public Records
Tax History
| Year | Tax Paid | Tax Assessment Tax Assessment Total Assessment is a certain percentage of the fair market value that is determined by local assessors to be the total taxable value of land and additions on the property. | Land | Improvement |
|---|---|---|---|---|
| 2025 | $8,829 | $964,900 | $417,100 | $547,800 |
| 2024 | $8,581 | $917,800 | $397,300 | $520,500 |
| 2023 | $8,684 | $832,600 | $355,900 | $476,700 |
| 2022 | $8,111 | $765,200 | $322,800 | $442,400 |
| 2021 | $8,335 | $758,400 | $322,800 | $435,600 |
| 2020 | $8,523 | $728,500 | $306,200 | $422,300 |
| 2019 | $7,962 | $709,000 | $291,300 | $417,700 |
| 2018 | $7,820 | $709,000 | $291,300 | $417,700 |
| 2017 | $7,508 | $682,500 | $264,800 | $417,700 |
| 2016 | $7,334 | $662,500 | $264,800 | $397,700 |
| 2015 | $7,003 | $646,000 | $248,300 | $397,700 |
Source: Public Records
Map
Nearby Homes
Your Personal Tour Guide
Ask me questions while you tour the home.