112 Pleasant St Conway, MA 01341
Estimated Value: $243,884 - $355,000
About This Home
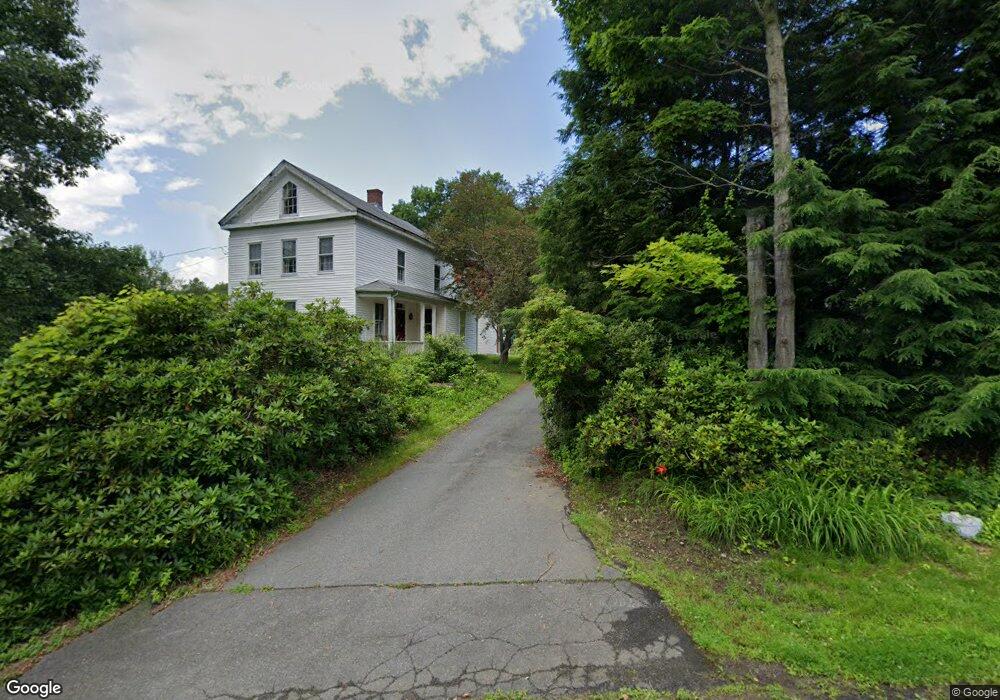
This home is located at 112 Pleasant St, Conway, MA 01341 and is currently estimated at $306,971, approximately $229 per square foot. 112 Pleasant St is a home with nearby schools including Frontier Regional School.
Ownership History
We collect this data history from publicly available records. To have your information removed, we recommend requesting removal directly through your county’s website.
Purchase Details
Home Financials for this Owner
Home Financials are based on the most recent Mortgage that was taken out on this home.Home Values in the Area
Average Home Value in this Area
Purchase History
We collect this data history from publicly available records. To have your information removed, we recommend requesting removal directly through your county’s website.
| Date | Buyer | Sale Price | Title Company |
|---|---|---|---|
| $200,000 | None Available |
Mortgage History
We collect this data history from publicly available records. To have your information removed, we recommend requesting removal directly through your county’s website.
| Date | Status | Borrower | Loan Amount |
|---|---|---|---|
| Closed | $100,000 | ||
| Closed | $122,625 | ||
| Closed | $132,500 |
Tax History
We collect this data history from publicly available records. To have your information removed, we recommend requesting removal directly through your county’s website.
| Year | Tax Paid | Tax Assessment Tax Assessment Total Assessment is a certain percentage of the fair market value that is determined by local assessors to be the total taxable value of land and additions on the property. | Land | Improvement |
|---|---|---|---|---|
| 2025 | $2,599 | $180,000 | $75,400 | $104,600 |
| 2024 | $2,558 | $156,000 | $68,600 | $87,400 |
| 2023 | $2,675 | $156,000 | $68,600 | $87,400 |
| 2022 | $2,574 | $143,400 | $62,500 | $80,900 |
| 2021 | $2,540 | $135,600 | $59,600 | $76,000 |
| 2020 | $2,489 | $132,700 | $59,300 | $73,400 |
| 2019 | $2,587 | $138,700 | $65,300 | $73,400 |
| 2018 | $2,566 | $138,700 | $65,300 | $73,400 |
| 2017 | $2,462 | $138,700 | $65,300 | $73,400 |
| 2016 | $2,128 | $127,600 | $57,000 | $70,600 |
| 2015 | $2,063 | $127,600 | $57,000 | $70,600 |
Map
- 0 Maple St
- 55 Ashfield Rd
- 87 Ashfield Rd
- 0 Boyden Rd
- 1230 Main Poland Rd
- 40 Whately Glen Rd
- 40 Mathews Rd
- 72 Stillwater Rd Unit A
- 6 Duncan Dr Unit B
- 49 Sawmill Plain Rd
- 54 Sawmill Plain Rd
- 965 Conway Rd
- 0 N Bear River Rd Unit 73485981
- 2930 Shelburne Falls Rd
- 287 Williamsburg Rd
- 14 South St
- 193 Norton Hill Rd
- 392 Greenfield Rd
- 0 Greenfield Rd Unit 73472322
- TBD Lower Rd
Ask me questions while you tour the home.