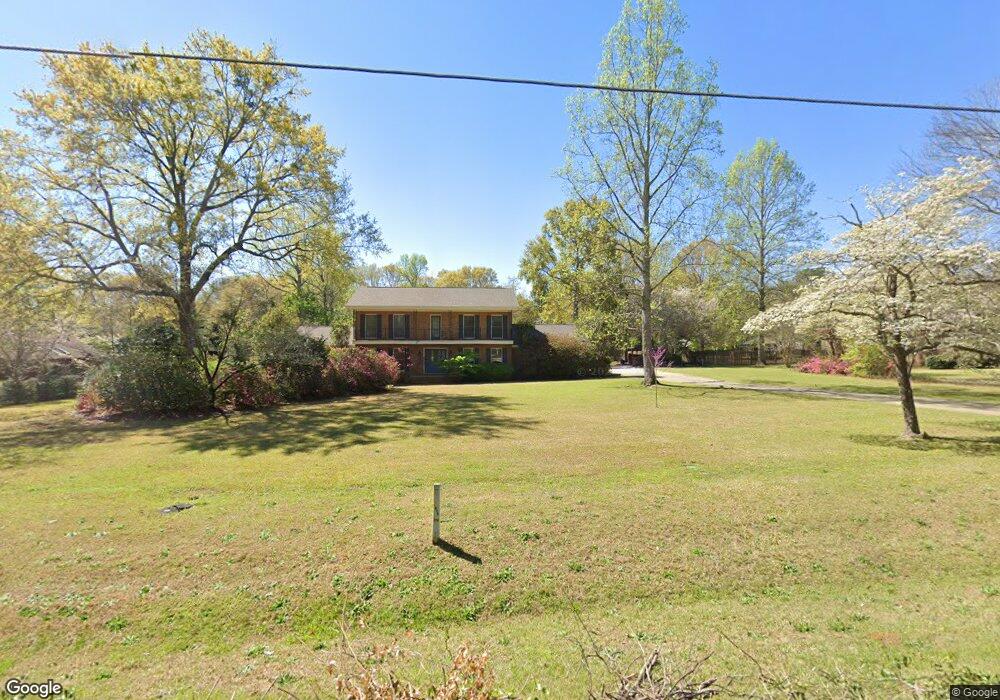
112 Quail Run Dr Warner Robins, GA 31088
Estimated Value: $379,239 - $423,000
5
Beds
4
Baths
3,694
Sq Ft
$108/Sq Ft
Est. Value
About This Home
This home is located at 112 Quail Run Dr, Warner Robins, GA 31088 and is currently estimated at $400,560, approximately $108 per square foot. 112 Quail Run Dr is a home located in Houston County with nearby schools including Quail Run Elementary School, Thomson Middle School, and Northside High School.
Ownership History
Date
Name
Owned For
Owner Type
Purchase Details
Closed on
Jun 5, 2006
Sold by
Ward Stan and Ward Lisa M
Bought by
Brown Robert D and Brown Bonnie L
Current Estimated Value
Home Financials for this Owner
Home Financials are based on the most recent Mortgage that was taken out on this home.
Original Mortgage
$186,400
Outstanding Balance
$109,158
Interest Rate
6.5%
Mortgage Type
New Conventional
Estimated Equity
$291,402
Purchase Details
Closed on
Oct 29, 1999
Sold by
Mcdaniel William H and Mcdaniel Janice B
Bought by
Ward Stan and Ward Lisa M
Purchase Details
Closed on
Apr 1, 1978
Sold by
Ross James
Bought by
Mcdaniel William H and Mcdaniel Janice B
Purchase Details
Closed on
Apr 11, 1977
Sold by
Thomas Ronald M and Thomas Judith M
Bought by
Ross James
Purchase Details
Closed on
Jun 4, 1975
Sold by
Byrd Robert S and Mcneal Larry M
Bought by
Thomas Ronald M and Thomas Judith M
Create a Home Valuation Report for This Property
The Home Valuation Report is an in-depth analysis detailing your home's value as well as a comparison with similar homes in the area
Home Values in the Area
Average Home Value in this Area
Purchase History
| Date | Buyer | Sale Price | Title Company |
|---|---|---|---|
| Brown Robert D | $233,000 | None Available | |
| Ward Stan | $195,000 | -- | |
| Mcdaniel William H | -- | -- | |
| Ross James | -- | -- | |
| Thomas Ronald M | -- | -- |
Source: Public Records
Mortgage History
| Date | Status | Borrower | Loan Amount |
|---|---|---|---|
| Open | Brown Robert D | $186,400 |
Source: Public Records
Tax History Compared to Growth
Tax History
| Year | Tax Paid | Tax Assessment Tax Assessment Total Assessment is a certain percentage of the fair market value that is determined by local assessors to be the total taxable value of land and additions on the property. | Land | Improvement |
|---|---|---|---|---|
| 2024 | $3,335 | $139,400 | $12,000 | $127,400 |
| 2023 | $2,757 | $114,080 | $12,000 | $102,080 |
| 2022 | $2,537 | $104,960 | $11,200 | $93,760 |
| 2021 | $2,398 | $98,720 | $11,200 | $87,520 |
| 2020 | $2,205 | $90,320 | $11,200 | $79,120 |
| 2019 | $2,205 | $90,320 | $11,200 | $79,120 |
| 2018 | $2,205 | $90,320 | $11,200 | $79,120 |
| 2017 | $2,207 | $90,320 | $11,200 | $79,120 |
| 2016 | $2,210 | $90,320 | $11,200 | $79,120 |
| 2015 | $2,200 | $89,720 | $11,200 | $78,520 |
| 2014 | -- | $89,720 | $11,200 | $78,520 |
| 2013 | -- | $89,720 | $11,200 | $78,520 |
Source: Public Records
Map
Nearby Homes
- 406 Quail Run Dr
- 112 Scotsburg Dr
- 108 Water Dr
- 116 Joy Dr
- 114 Wavertree Dr
- 100 Athena Terrace
- 203 Morning Dove Ln
- 122 Wavertree Dr
- 111 Glacier Trail
- 103 Emberly Ln
- 322 Pheasant Ridge Dr
- 403 Wiltshire Ct
- 115 Springtime Dr
- 314 Briarmoor Dr
- 102 Monarch Place
- 3234 US Highway 41
- 204 Falkirk Dr
- 0 Lakeview Rd
- 108 Covey Run Dr
- 320 Ellicott Dr
- 114 Quail Run Dr
- 110 Quail Run Dr
- 108 Quail Run Dr
- 116 Quail Run Dr
- 115 Quail Run Dr
- 119 Whippoorwill Dr
- 115 Whippoorwill Dr
- 117 Quail Run Dr
- 113 Quail Run Dr
- 121 Whippoorwill Dr
- 113 Whippoorwill Dr
- 119 Quail Run Dr
- 118 Quail Run Dr
- 123 Whippoorwill Dr
- 106 Quail Run Dr
- 111 Whippoorwill Dr
- 111 Quail Run Dr
- 114 Whippoorwill Dr
- 112 Whippoorwill Dr
- 116 Whippoorwill Dr