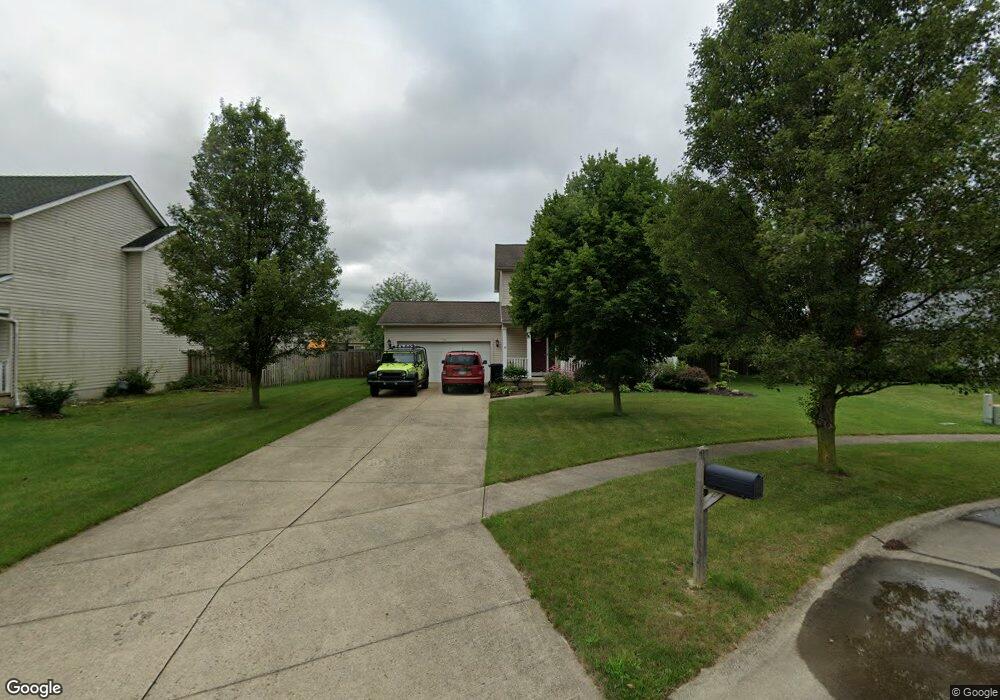
112 Raven Cir Elyria, OH 44035
Estimated Value: $271,000 - $297,000
3
Beds
3
Baths
1,508
Sq Ft
$188/Sq Ft
Est. Value
About This Home
This home is located at 112 Raven Cir, Elyria, OH 44035 and is currently estimated at $284,096, approximately $188 per square foot. 112 Raven Cir is a home located in Lorain County with nearby schools including Midview West Elementary School, Midview North Elementary School, and Midview Middle School.
Ownership History
Date
Name
Owned For
Owner Type
Purchase Details
Closed on
Apr 7, 2009
Sold by
Gross James A
Bought by
Gross Mary L
Current Estimated Value
Home Financials for this Owner
Home Financials are based on the most recent Mortgage that was taken out on this home.
Original Mortgage
$56,000
Outstanding Balance
$14,570
Interest Rate
5.05%
Mortgage Type
Purchase Money Mortgage
Estimated Equity
$269,526
Purchase Details
Closed on
Sep 10, 1998
Sold by
Linna Homes Inc
Bought by
Gross James A and Gross Mary L
Home Financials for this Owner
Home Financials are based on the most recent Mortgage that was taken out on this home.
Original Mortgage
$82,000
Interest Rate
7.06%
Purchase Details
Closed on
May 18, 1998
Sold by
Chestnut Ridge Development Co
Bought by
Linna Homes Inc
Home Financials for this Owner
Home Financials are based on the most recent Mortgage that was taken out on this home.
Original Mortgage
$122,000
Interest Rate
7.25%
Mortgage Type
Credit Line Revolving
Create a Home Valuation Report for This Property
The Home Valuation Report is an in-depth analysis detailing your home's value as well as a comparison with similar homes in the area
Home Values in the Area
Average Home Value in this Area
Purchase History
| Date | Buyer | Sale Price | Title Company |
|---|---|---|---|
| Gross Mary L | -- | Evergreen Title | |
| Gross James A | $141,900 | Midland Title | |
| Linna Homes Inc | $33,000 | Midland Title |
Source: Public Records
Mortgage History
| Date | Status | Borrower | Loan Amount |
|---|---|---|---|
| Open | Gross Mary L | $56,000 | |
| Closed | Gross James A | $82,000 | |
| Previous Owner | Linna Homes Inc | $122,000 |
Source: Public Records
Tax History
| Year | Tax Paid | Tax Assessment Tax Assessment Total Assessment is a certain percentage of the fair market value that is determined by local assessors to be the total taxable value of land and additions on the property. | Land | Improvement |
|---|---|---|---|---|
| 2024 | $2,874 | $77,518 | $22,050 | $55,468 |
| 2023 | $2,891 | $62,615 | $14,028 | $48,587 |
| 2022 | $2,883 | $62,615 | $14,028 | $48,587 |
| 2021 | $2,892 | $62,615 | $14,028 | $48,587 |
| 2020 | $2,714 | $54,680 | $12,250 | $42,430 |
| 2019 | $2,704 | $54,680 | $12,250 | $42,430 |
| 2018 | $2,720 | $54,680 | $12,250 | $42,430 |
| 2017 | $2,704 | $49,930 | $12,620 | $37,310 |
| 2016 | $2,702 | $49,930 | $12,620 | $37,310 |
| 2015 | $2,718 | $49,930 | $12,620 | $37,310 |
| 2014 | $2,687 | $48,480 | $12,250 | $36,230 |
| 2013 | $2,771 | $48,480 | $12,250 | $36,230 |
Source: Public Records
Map
Nearby Homes
- 348 Pemberton Dr
- 10488 Dewhurst Rd
- 134 California Ave
- 121 Oakley Green Dr Unit 13
- 124 Oakley Green Dr
- 475 Carol Ln
- 38227 Chestnut Ridge Rd
- 239 Syracuse Ct
- 321 Kansas Ave
- 418 Carol Ln
- 128 Richmond Ct
- 134 Richmond Ct
- 217 Syracuse Ct
- Forsythia Plan at Harvest Meadows
- Goldenrod Plan at Harvest Meadows
- Water Lily Plan at Harvest Meadows
- Bluebell Plan at Harvest Meadows
- Oleander Plan at Harvest Meadows
- Daffodil Plan at Harvest Meadows
- 104 Willow Way
- 108 Raven Cir
- 116 Raven Cir
- 330 Sandpiper Ave
- 324 Sandpiper Ave
- 334 Sandpiper Ave
- 104 Raven Cir
- 120 Raven Cir
- 318 Sandpiper Ave
- 340 Sandpiper Ave
- 113 Raven Cir
- 109 Raven Cir
- 123 Raven Cir
- 312 Sandpiper Ave
- 117 Raven Cir
- 105 Raven Cir
- 609 Song Bird St
- 615 Song Bird St
- 621 Song Bird St
- 306 Sandpiper Ave
- 331 Sandpiper Ave