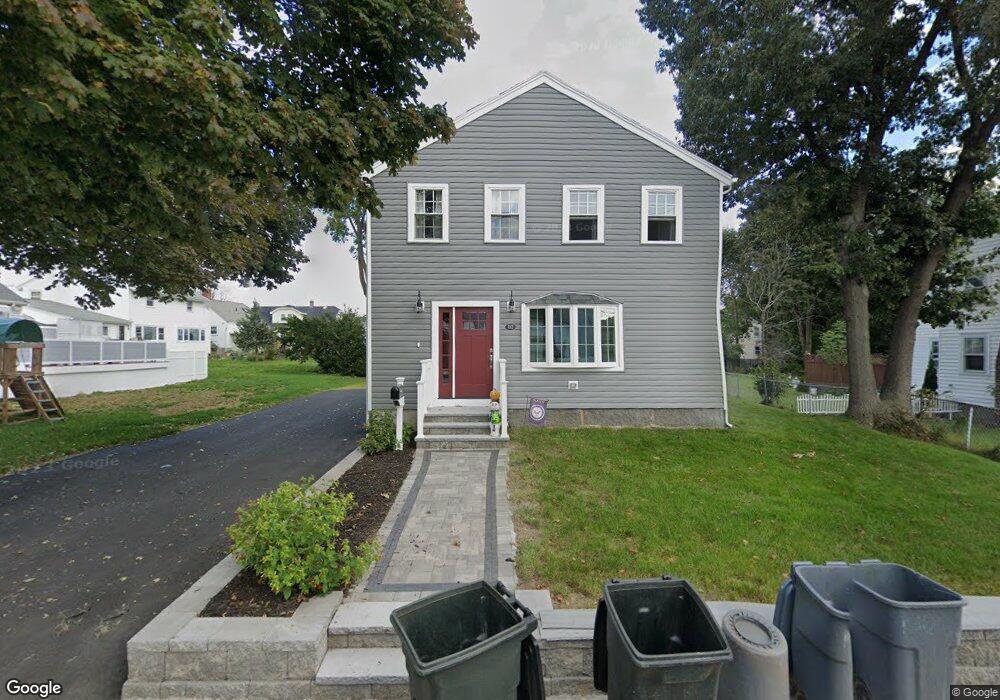
112 Robertson St Quincy, MA 02169
West Quincy NeighborhoodEstimated Value: $898,000 - $1,002,000
5
Beds
3
Baths
2,444
Sq Ft
$393/Sq Ft
Est. Value
About This Home
This home is located at 112 Robertson St, Quincy, MA 02169 and is currently estimated at $959,435, approximately $392 per square foot. 112 Robertson St is a home located in Norfolk County with nearby schools including Montclair Elementary School, Atlantic Middle School, and North Quincy High School.
Ownership History
Date
Name
Owned For
Owner Type
Purchase Details
Closed on
Feb 1, 2024
Sold by
Strout Brian W and Strout Kerri A
Bought by
Lower Falls Lt and Strout
Current Estimated Value
Purchase Details
Closed on
Nov 23, 2022
Sold by
Strout Brian
Bought by
Strout Brian W and Strout Kerri A
Purchase Details
Closed on
Dec 5, 2021
Sold by
Strout Brian and Strout Adam
Bought by
Strout Brian and Strout Amy
Purchase Details
Closed on
Jan 11, 2001
Sold by
Strout Loren W and Strout Nancy E
Bought by
Strout Brian and Strout Amy E
Home Financials for this Owner
Home Financials are based on the most recent Mortgage that was taken out on this home.
Original Mortgage
$80,000
Interest Rate
7.64%
Mortgage Type
Purchase Money Mortgage
Create a Home Valuation Report for This Property
The Home Valuation Report is an in-depth analysis detailing your home's value as well as a comparison with similar homes in the area
Home Values in the Area
Average Home Value in this Area
Purchase History
| Date | Buyer | Sale Price | Title Company |
|---|---|---|---|
| Lower Falls Lt | -- | None Available | |
| Strout Brian W | -- | None Available | |
| Strout Brian | -- | None Available | |
| Strout Brian | $220,000 | -- |
Source: Public Records
Mortgage History
| Date | Status | Borrower | Loan Amount |
|---|---|---|---|
| Previous Owner | Strout Brian | $80,000 | |
| Previous Owner | Strout Brian | $65,000 | |
| Closed | Strout Brian | $90,000 |
Source: Public Records
Tax History Compared to Growth
Tax History
| Year | Tax Paid | Tax Assessment Tax Assessment Total Assessment is a certain percentage of the fair market value that is determined by local assessors to be the total taxable value of land and additions on the property. | Land | Improvement |
|---|---|---|---|---|
| 2025 | $10,204 | $885,000 | $316,900 | $568,100 |
| 2024 | $9,572 | $849,300 | $302,100 | $547,200 |
| 2023 | $7,413 | $666,000 | $288,000 | $378,000 |
| 2022 | $7,470 | $623,500 | $231,300 | $392,200 |
| 2021 | $7,044 | $580,200 | $231,300 | $348,900 |
| 2020 | $7,148 | $575,100 | $231,300 | $343,800 |
| 2019 | $7,081 | $564,200 | $224,800 | $339,400 |
| 2018 | $6,879 | $515,700 | $208,500 | $307,200 |
| 2017 | $6,867 | $484,600 | $198,800 | $285,800 |
| 2016 | $6,390 | $445,000 | $181,200 | $263,800 |
| 2015 | $6,041 | $413,800 | $171,200 | $242,600 |
| 2014 | $5,699 | $383,500 | $171,200 | $212,300 |
Source: Public Records
Map
Nearby Homes
- 64 Willard St Unit 302
- 19 Seymour St
- 73 Connell St
- 27 Shirley St
- 41 Wallace Rd
- 47 Connell St
- 230 Willard St Unit 204
- 141 Gardiner Rd
- 83 Forbes Hill Rd
- 64 Shawmut St
- 29 Oconnell Ave
- 11 Rockwell Ave
- 9 Common St Unit 3
- 328 Copeland St Unit 3E
- 9 Cross St Unit 11
- 41 Filbert St
- 260 Elmwood Ave
- 37 Wren Terrace Unit 2
- 2 Ricciuti Dr Unit 8
- 86 Wren Terrace Unit A
- 118 Robertson St
- 106 Robertson St
- 166 Connell St
- 11 Whitman Rd
- 9 Whitman Rd
- 15 Whitman Rd
- 126 Robertson St
- 160 Connell St
- 113 Robertson St
- 19 Whitman Rd
- 117 Robertson St
- 156 Connell St
- 103 Robertson St
- 100 Robertson St
- 10 Ballou St
- 99 Robertson St
- 134 Robertson St
- 10 Whitman Rd
- 150 Connell St
- 93 Shirley St