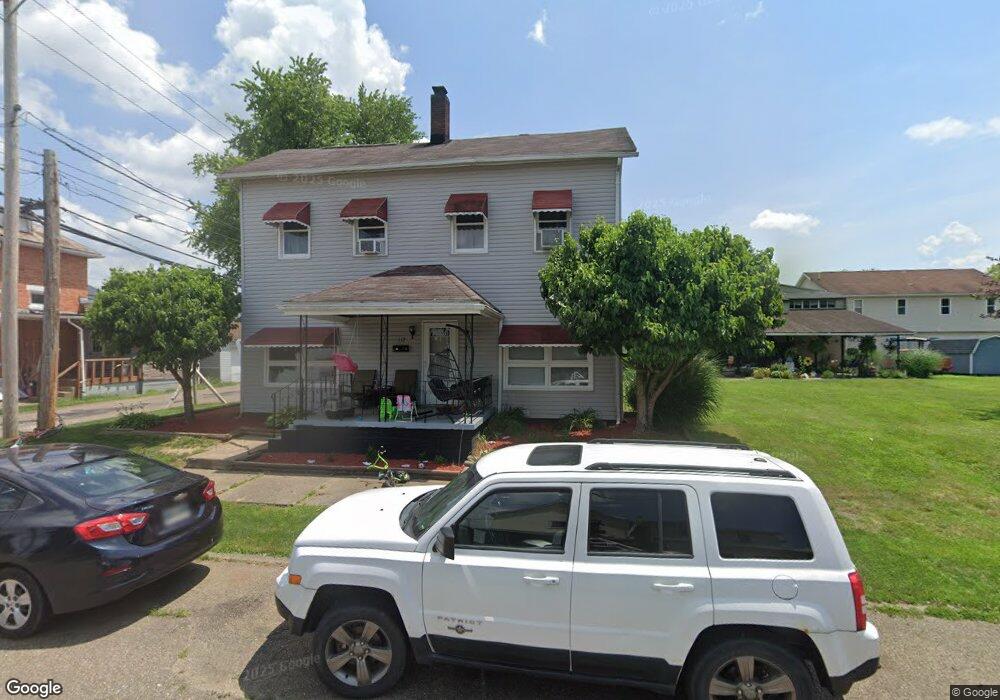
112 S 5th St Dennison, OH 44621
Estimated Value: $96,000 - $163,000
3
Beds
2
Baths
1,936
Sq Ft
$69/Sq Ft
Est. Value
About This Home
This home is located at 112 S 5th St, Dennison, OH 44621 and is currently estimated at $133,832, approximately $69 per square foot. 112 S 5th St is a home located in Tuscarawas County with nearby schools including Claymont High School and Immaculate Conception School.
Ownership History
Date
Name
Owned For
Owner Type
Purchase Details
Closed on
Mar 13, 2024
Sold by
Gilmore David H and Gilmore Theresa M
Bought by
Bedard Allen and Bedard Anna
Current Estimated Value
Home Financials for this Owner
Home Financials are based on the most recent Mortgage that was taken out on this home.
Original Mortgage
$78,551
Interest Rate
6.79%
Mortgage Type
FHA
Purchase Details
Closed on
Feb 18, 2005
Sold by
Stauffer Kevin R and Stauffer Denise E
Bought by
Gilmore David H and Gilmore Theresa M
Home Financials for this Owner
Home Financials are based on the most recent Mortgage that was taken out on this home.
Original Mortgage
$44,450
Interest Rate
5.78%
Mortgage Type
Fannie Mae Freddie Mac
Purchase Details
Closed on
Feb 28, 1992
Sold by
Feri Helen M and Stauffer Denise E
Bought by
Stauffer Kevin R and Stauffer Denise E
Purchase Details
Closed on
Jun 1, 1987
Bought by
Feri Helen M and Gilmore Theresa M
Create a Home Valuation Report for This Property
The Home Valuation Report is an in-depth analysis detailing your home's value as well as a comparison with similar homes in the area
Home Values in the Area
Average Home Value in this Area
Purchase History
| Date | Buyer | Sale Price | Title Company |
|---|---|---|---|
| Bedard Allen | $80,000 | None Listed On Document | |
| Gilmore David H | $49,400 | Tusc Title | |
| Stauffer Kevin R | $29,000 | -- | |
| Feri Helen M | -- | -- |
Source: Public Records
Mortgage History
| Date | Status | Borrower | Loan Amount |
|---|---|---|---|
| Previous Owner | Bedard Allen | $78,551 | |
| Previous Owner | Gilmore David H | $44,450 |
Source: Public Records
Tax History
| Year | Tax Paid | Tax Assessment Tax Assessment Total Assessment is a certain percentage of the fair market value that is determined by local assessors to be the total taxable value of land and additions on the property. | Land | Improvement |
|---|---|---|---|---|
| 2024 | $979 | $26,310 | $3,850 | $22,460 |
| 2023 | $979 | $75,170 | $11,000 | $64,170 |
| 2022 | $985 | $26,310 | $3,850 | $22,460 |
| 2021 | $882 | $21,935 | $2,489 | $19,446 |
| 2020 | $900 | $21,935 | $2,489 | $19,446 |
| 2019 | $863 | $21,935 | $2,489 | $19,446 |
| 2018 | $785 | $18,510 | $2,100 | $16,410 |
| 2017 | $807 | $18,510 | $2,100 | $16,410 |
| 2016 | $802 | $18,510 | $2,100 | $16,410 |
| 2014 | $826 | $18,900 | $2,100 | $16,800 |
| 2013 | $832 | $18,900 | $2,100 | $16,800 |
Source: Public Records
Map
Nearby Homes
- 318 Bank St
- 530 E High St
- 11 Sherman St
- 118 Woodland Ave
- 214 N Dawson St
- 129 S Main St
- 228 Gardner Ave
- 426 Mccrea Ave
- 213 Fuhr St
- 618 Parrish St
- 214 W 7th St
- 911 N Water St
- 315 Orchard St
- 507 W 3rd St
- 515 W 3rd St
- 4848 Fette Rd SE
- 621 Newport Ave
- 604 W 1st St
- 1107 Parrish St
- 7261 Waterworks Hill Rd SE
Your Personal Tour Guide
Ask me questions while you tour the home.