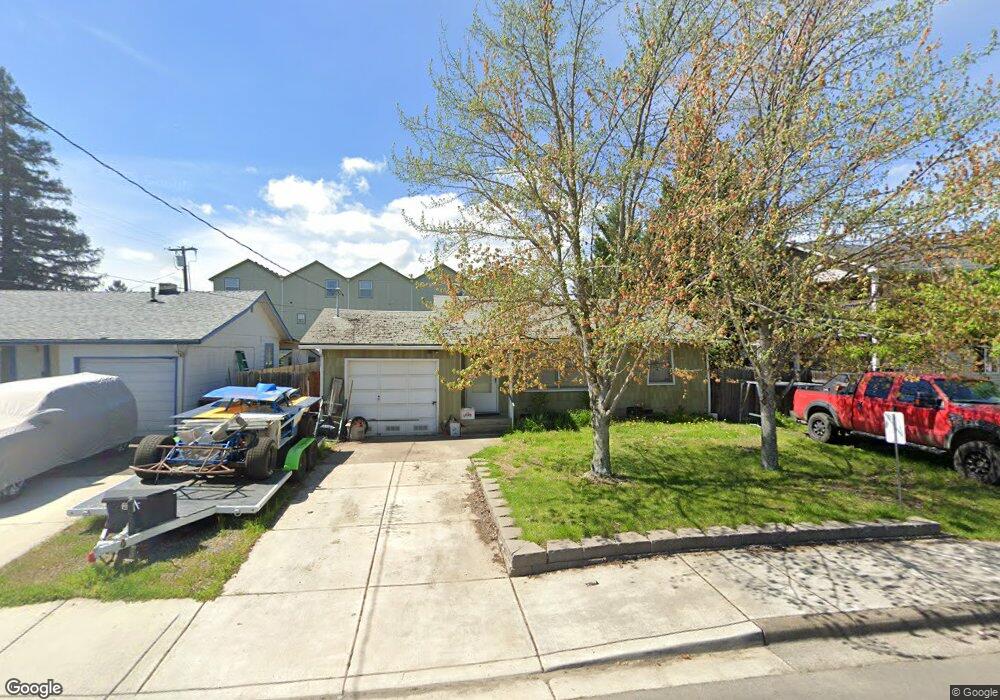
112 S Haskell St Central Point, OR 97502
Estimated Value: $251,201 - $290,000
2
Beds
1
Bath
756
Sq Ft
$352/Sq Ft
Est. Value
About This Home
This home is located at 112 S Haskell St, Central Point, OR 97502 and is currently estimated at $266,300, approximately $352 per square foot. 112 S Haskell St is a home located in Jackson County with nearby schools including Richardson Elementary School, Scenic Middle School, and Crater High School.
Ownership History
Date
Name
Owned For
Owner Type
Purchase Details
Closed on
Nov 30, 2021
Sold by
Rapp William R and Rapp Valerie A
Bought by
Rapp Valerie A and Rapp William R
Current Estimated Value
Home Financials for this Owner
Home Financials are based on the most recent Mortgage that was taken out on this home.
Original Mortgage
$182,021
Outstanding Balance
$165,883
Interest Rate
3.05%
Mortgage Type
New Conventional
Estimated Equity
$100,417
Purchase Details
Closed on
Feb 27, 2012
Sold by
Rapp William R and Rapp Valerie A
Bought by
Adams Agda
Create a Home Valuation Report for This Property
The Home Valuation Report is an in-depth analysis detailing your home's value as well as a comparison with similar homes in the area
Purchase History
| Date | Buyer | Sale Price | Title Company |
|---|---|---|---|
| Rapp Valerie A | -- | Ticor Title | |
| Adams Agda | -- | First American Title |
Source: Public Records
Mortgage History
| Date | Status | Borrower | Loan Amount |
|---|---|---|---|
| Open | Rapp Valerie A | $182,021 |
Source: Public Records
Tax History
| Year | Tax Paid | Tax Assessment Tax Assessment Total Assessment is a certain percentage of the fair market value that is determined by local assessors to be the total taxable value of land and additions on the property. | Land | Improvement |
|---|---|---|---|---|
| 2026 | $1,872 | $113,090 | -- | -- |
| 2025 | $1,826 | $109,800 | $63,360 | $46,440 |
| 2024 | $1,826 | $106,610 | $61,520 | $45,090 |
| 2023 | $1,767 | $103,510 | $59,730 | $43,780 |
| 2022 | $1,726 | $103,510 | $59,730 | $43,780 |
| 2021 | $1,677 | $100,500 | $57,990 | $42,510 |
| 2020 | $1,628 | $97,580 | $56,300 | $41,280 |
| 2019 | $1,588 | $91,990 | $53,070 | $38,920 |
| 2018 | $1,539 | $89,320 | $51,530 | $37,790 |
| 2017 | $1,501 | $89,320 | $51,530 | $37,790 |
| 2016 | $1,457 | $84,200 | $48,580 | $35,620 |
| 2015 | $1,396 | $84,200 | $48,580 | $35,620 |
| 2014 | $1,506 | $79,370 | $45,800 | $33,570 |
Source: Public Records
Map
Nearby Homes
Your Personal Tour Guide
Ask me questions while you tour the home.