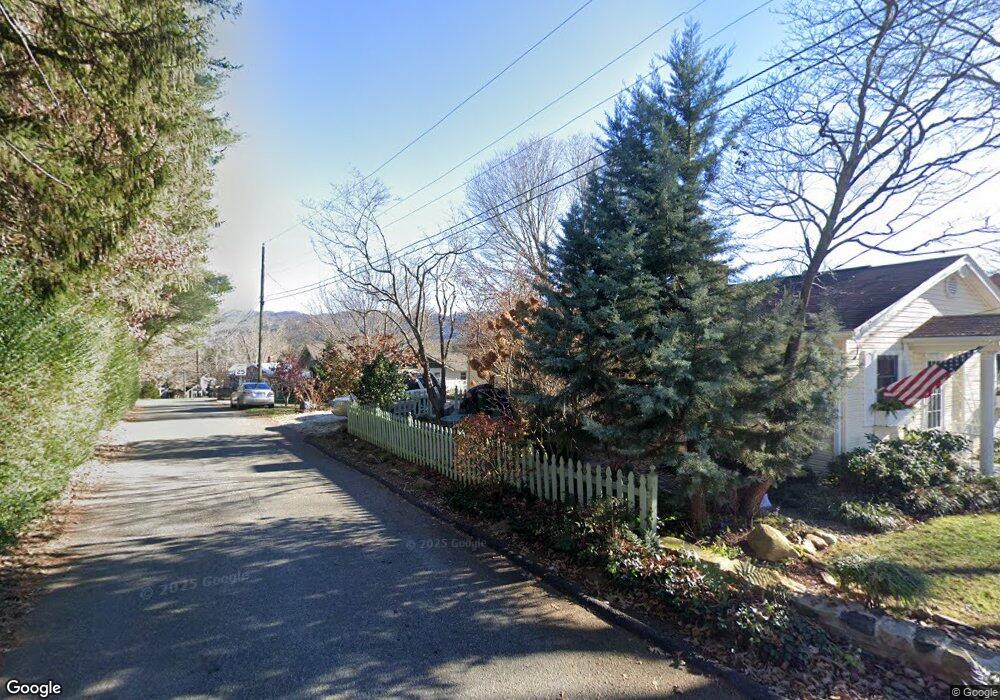
112 S Main St Weaverville, NC 28787
Estimated Value: $414,000 - $551,000
3
Beds
2
Baths
2,300
Sq Ft
$201/Sq Ft
Est. Value
About This Home
This home is located at 112 S Main St, Weaverville, NC 28787 and is currently estimated at $463,133, approximately $201 per square foot. 112 S Main St is a home located in Buncombe County with nearby schools including Weaverville Elementary, Weaverville Primary, and North Buncombe Middle.
Ownership History
Date
Name
Owned For
Owner Type
Purchase Details
Closed on
Dec 14, 2023
Sold by
Lawrence Neil Steven and Lawrence Jennifer Anne
Bought by
Laurel Crown Trust and Lawrence
Current Estimated Value
Purchase Details
Closed on
Nov 23, 2010
Sold by
Bain Lee L and Bain Celia
Bought by
Lawrence Neil Steven and Lawrence Jennifer Anne
Home Financials for this Owner
Home Financials are based on the most recent Mortgage that was taken out on this home.
Original Mortgage
$165,690
Interest Rate
4.33%
Mortgage Type
FHA
Purchase Details
Closed on
Sep 22, 1998
Sold by
Silva Gustavo D
Bought by
Bain Lee L and Bain Celia
Home Financials for this Owner
Home Financials are based on the most recent Mortgage that was taken out on this home.
Original Mortgage
$116,100
Interest Rate
6.92%
Mortgage Type
Unknown
Purchase Details
Closed on
Oct 27, 1997
Sold by
Joyner C Daniel
Bought by
Silva
Create a Home Valuation Report for This Property
The Home Valuation Report is an in-depth analysis detailing your home's value as well as a comparison with similar homes in the area
Home Values in the Area
Average Home Value in this Area
Purchase History
| Date | Buyer | Sale Price | Title Company |
|---|---|---|---|
| Laurel Crown Trust | -- | None Listed On Document | |
| Laurel Crown Trust | -- | None Listed On Document | |
| Lawrence Neil Steven | $170,000 | None Available | |
| Bain Lee L | $129,000 | -- | |
| Silva | $80,000 | -- |
Source: Public Records
Mortgage History
| Date | Status | Borrower | Loan Amount |
|---|---|---|---|
| Previous Owner | Lawrence Neil Steven | $165,690 | |
| Previous Owner | Bain Lee L | $116,100 |
Source: Public Records
Tax History Compared to Growth
Tax History
| Year | Tax Paid | Tax Assessment Tax Assessment Total Assessment is a certain percentage of the fair market value that is determined by local assessors to be the total taxable value of land and additions on the property. | Land | Improvement |
|---|---|---|---|---|
| 2025 | $2,000 | $230,500 | $57,100 | $173,400 |
| 2024 | $2,000 | $230,500 | $57,100 | $173,400 |
| 2023 | $2,000 | $230,500 | $57,100 | $173,400 |
| 2022 | $1,932 | $230,500 | $0 | $0 |
| 2021 | $1,932 | $230,500 | $0 | $0 |
| 2020 | $1,840 | $202,400 | $0 | $0 |
| 2019 | $1,071 | $202,400 | $0 | $0 |
| 2018 | $1,071 | $202,400 | $0 | $0 |
| 2017 | $937 | $155,200 | $0 | $0 |
| 2016 | $937 | $155,200 | $0 | $0 |
| 2015 | $937 | $155,200 | $0 | $0 |
| 2014 | $937 | $155,200 | $0 | $0 |
Source: Public Records
Map
Nearby Homes