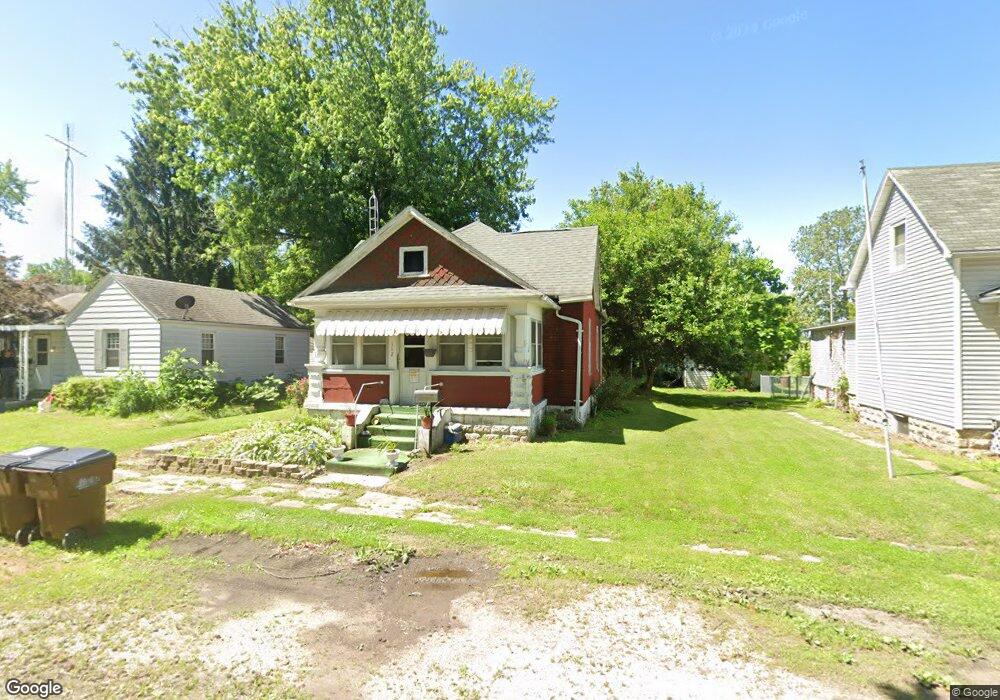
112 S Vine St Nokomis, IL 62075
Estimated Value: $50,000 - $58,197
--
Bed
--
Bath
984
Sq Ft
$56/Sq Ft
Est. Value
About This Home
This home is located at 112 S Vine St, Nokomis, IL 62075 and is currently estimated at $55,049, approximately $55 per square foot. 112 S Vine St is a home located in Montgomery County with nearby schools including North Elementary School, Nokomis Junior/Senior High School, and St. Louis Catholic School.
Ownership History
Date
Name
Owned For
Owner Type
Purchase Details
Closed on
Apr 27, 2015
Sold by
Gunning Samuel E
Bought by
Gunning Samantha
Current Estimated Value
Purchase Details
Closed on
Mar 30, 2007
Sold by
Alexander Francis and Alexander Dawn
Bought by
Gunning Samuel E and Gunning Samantha
Home Financials for this Owner
Home Financials are based on the most recent Mortgage that was taken out on this home.
Original Mortgage
$27,550
Interest Rate
6.75%
Mortgage Type
New Conventional
Purchase Details
Closed on
May 25, 2005
Sold by
Halleman Larry L and Halleman Shelley K
Bought by
Alexander Francis and Alexander Dawn
Create a Home Valuation Report for This Property
The Home Valuation Report is an in-depth analysis detailing your home's value as well as a comparison with similar homes in the area
Home Values in the Area
Average Home Value in this Area
Purchase History
| Date | Buyer | Sale Price | Title Company |
|---|---|---|---|
| Gunning Samantha | -- | -- | |
| Gunning Samuel E | $29,000 | Advanced Title Group Inc | |
| Alexander Francis | $25,000 | None Available |
Source: Public Records
Mortgage History
| Date | Status | Borrower | Loan Amount |
|---|---|---|---|
| Previous Owner | Gunning Samuel E | $27,550 |
Source: Public Records
Tax History Compared to Growth
Tax History
| Year | Tax Paid | Tax Assessment Tax Assessment Total Assessment is a certain percentage of the fair market value that is determined by local assessors to be the total taxable value of land and additions on the property. | Land | Improvement |
|---|---|---|---|---|
| 2024 | $517 | $11,940 | $3,520 | $8,420 |
| 2023 | $457 | $11,200 | $3,300 | $7,900 |
| 2022 | $427 | $10,760 | $3,170 | $7,590 |
| 2021 | $463 | $11,240 | $3,310 | $7,930 |
| 2020 | $420 | $10,720 | $3,160 | $7,560 |
| 2019 | $470 | $11,320 | $3,340 | $7,980 |
| 2018 | $425 | $10,650 | $3,140 | $7,510 |
| 2017 | $422 | $10,010 | $2,950 | $7,060 |
| 2016 | $428 | $9,740 | $2,870 | $6,870 |
| 2015 | $413 | $9,430 | $2,780 | $6,650 |
| 2013 | -- | $9,540 | $2,810 | $6,730 |
Source: Public Records
Map
Nearby Homes