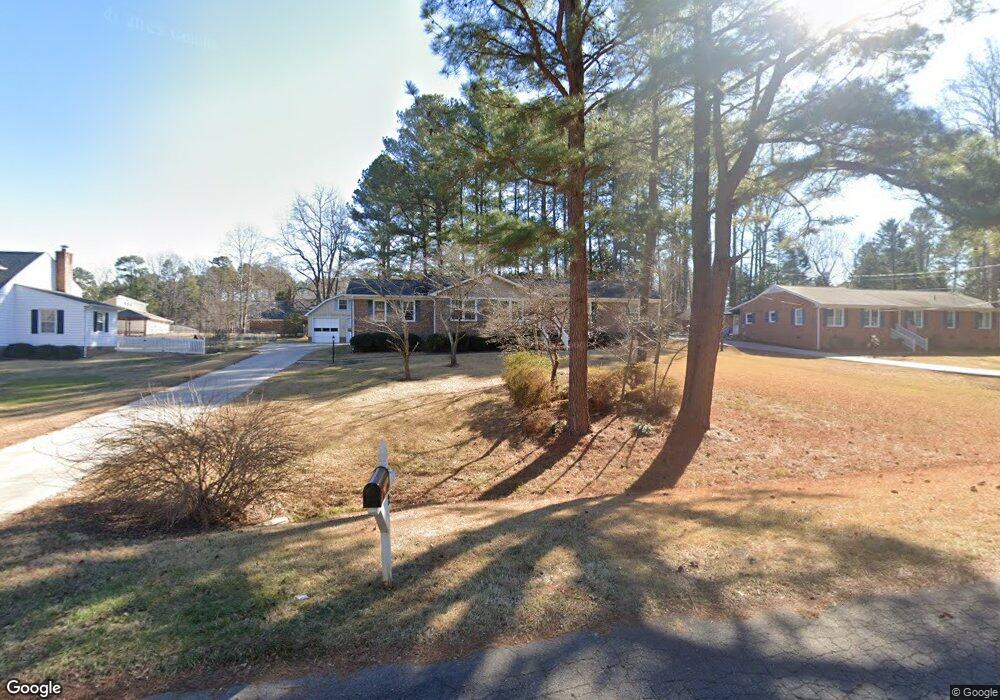
112 Saddletree Rd Oxford, NC 27565
Estimated Value: $346,000 - $365,000
3
Beds
2
Baths
1,830
Sq Ft
$194/Sq Ft
Est. Value
About This Home
This home is located at 112 Saddletree Rd, Oxford, NC 27565 and is currently estimated at $355,272, approximately $194 per square foot. 112 Saddletree Rd is a home located in Granville County with nearby schools including Stovall-Shaw Elementary School, Northern Granville Middle School, and Hill City High School.
Ownership History
Date
Name
Owned For
Owner Type
Purchase Details
Closed on
Jul 22, 2025
Sold by
Simpson Ellen J and Newton Michael S
Bought by
Goss Walter Brandon and Goss Emma Rae
Current Estimated Value
Home Financials for this Owner
Home Financials are based on the most recent Mortgage that was taken out on this home.
Original Mortgage
$315,000
Outstanding Balance
$314,466
Interest Rate
6.84%
Mortgage Type
New Conventional
Estimated Equity
$40,806
Purchase Details
Closed on
Jul 29, 2021
Sold by
Hart Randall E and Wilkins Nathaniel E
Bought by
Newton Michael S and Simpson Ellen J
Home Financials for this Owner
Home Financials are based on the most recent Mortgage that was taken out on this home.
Original Mortgage
$204,000
Interest Rate
2.93%
Mortgage Type
New Conventional
Purchase Details
Closed on
May 1, 1997
Bought by
Hart Francis E
Create a Home Valuation Report for This Property
The Home Valuation Report is an in-depth analysis detailing your home's value as well as a comparison with similar homes in the area
Home Values in the Area
Average Home Value in this Area
Purchase History
| Date | Buyer | Sale Price | Title Company |
|---|---|---|---|
| Goss Walter Brandon | $355,000 | None Listed On Document | |
| Newton Michael S | $255,000 | None Available | |
| Newton Michael S | $255,000 | Box Return | |
| Hart Francis E | -- | -- |
Source: Public Records
Mortgage History
| Date | Status | Borrower | Loan Amount |
|---|---|---|---|
| Open | Goss Walter Brandon | $315,000 | |
| Previous Owner | Newton Michael S | $204,000 |
Source: Public Records
Tax History Compared to Growth
Tax History
| Year | Tax Paid | Tax Assessment Tax Assessment Total Assessment is a certain percentage of the fair market value that is determined by local assessors to be the total taxable value of land and additions on the property. | Land | Improvement |
|---|---|---|---|---|
| 2025 | $3,055 | $260,837 | $50,000 | $210,837 |
| 2024 | $3,055 | $260,837 | $50,000 | $210,837 |
| 2023 | $3,053 | $178,575 | $35,000 | $143,575 |
| 2022 | $2,668 | $178,575 | $35,000 | $143,575 |
| 2021 | $2,663 | $178,575 | $35,000 | $143,575 |
| 2020 | $2,663 | $178,575 | $35,000 | $143,575 |
| 2019 | $2,663 | $178,575 | $35,000 | $143,575 |
| 2018 | $2,663 | $178,575 | $35,000 | $143,575 |
| 2016 | $2,685 | $175,303 | $35,000 | $140,303 |
| 2015 | $2,592 | $175,303 | $35,000 | $140,303 |
| 2014 | $2,592 | $175,303 | $35,000 | $140,303 |
| 2013 | -- | $175,303 | $35,000 | $140,303 |
Source: Public Records
Map
Nearby Homes
- 230 Saddletree Rd
- 102 Royall Rd
- 100 Maluli Dr
- 110 Maluli Dr
- 715 Williamsboro St
- 505 Forest Rd
- 504 Henderson St
- 103 Forest Rd
- 104 Parker St
- 412 Kingsbury St
- 0 Hillandale Dr
- 106 Summitt Ave
- 501 Raleigh St
- 617 Raleigh St
- 608 Raleigh St
- 221 Gilliam St
- 6609 Clearwater Dr
- 211 Wilmington Ave
- 412 Coggeshall St
- 304 Lanier St
- 110 Saddletree Rd
- 114 Saddletree Rd
- 111 Planters Glen Place
- 111 Planters Place
- 113 Planters Place
- 113 Saddletree Rd
- 108 Saddletree Rd
- 109 Planters Place
- 115 Planters Place
- 111 Saddletree Rd
- 107 Planters Glen Place
- 115 Saddletree Rd
- 117 Saddletree Rd
- 107 Planters Place
- 109 Saddletree Rd
- 119 Saddletree Rd
- 106 Saddletree Rd
- 121 Saddletree Rd
- 112 Planters Place
- 110 Planters Place