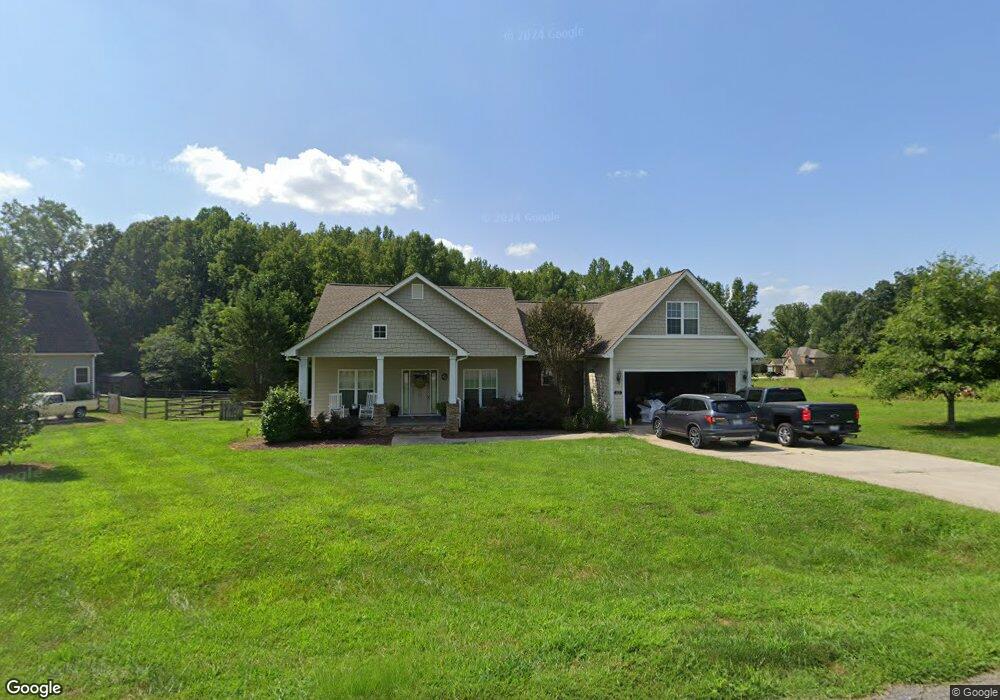
112 Sandalwood Ln Statesville, NC 28625
Estimated Value: $429,719 - $475,000
3
Beds
2
Baths
2,260
Sq Ft
$200/Sq Ft
Est. Value
About This Home
This home is located at 112 Sandalwood Ln, Statesville, NC 28625 and is currently estimated at $452,930, approximately $200 per square foot. 112 Sandalwood Ln is a home located in Iredell County with nearby schools including Cloverleaf Elementary School, East Iredell Middle School, and North Iredell High School.
Ownership History
Date
Name
Owned For
Owner Type
Purchase Details
Closed on
Jul 22, 2016
Sold by
Molyneaux Eric and Molyneaux Leah
Bought by
Lloyd Jason O and Lloyd Allyson C
Current Estimated Value
Home Financials for this Owner
Home Financials are based on the most recent Mortgage that was taken out on this home.
Original Mortgage
$221,400
Outstanding Balance
$176,858
Interest Rate
3.6%
Mortgage Type
New Conventional
Estimated Equity
$276,072
Purchase Details
Closed on
Sep 12, 2008
Sold by
Jd Anthony Custom Builders Inc
Bought by
Molyneaux Eric and Molyneaux Leah
Home Financials for this Owner
Home Financials are based on the most recent Mortgage that was taken out on this home.
Original Mortgage
$209,000
Interest Rate
6.48%
Mortgage Type
Purchase Money Mortgage
Create a Home Valuation Report for This Property
The Home Valuation Report is an in-depth analysis detailing your home's value as well as a comparison with similar homes in the area
Home Values in the Area
Average Home Value in this Area
Purchase History
| Date | Buyer | Sale Price | Title Company |
|---|---|---|---|
| Lloyd Jason O | $246,000 | None Available | |
| Molyneaux Eric | $220,000 | None Available |
Source: Public Records
Mortgage History
| Date | Status | Borrower | Loan Amount |
|---|---|---|---|
| Open | Lloyd Jason O | $221,400 | |
| Previous Owner | Molyneaux Eric | $209,000 |
Source: Public Records
Tax History Compared to Growth
Tax History
| Year | Tax Paid | Tax Assessment Tax Assessment Total Assessment is a certain percentage of the fair market value that is determined by local assessors to be the total taxable value of land and additions on the property. | Land | Improvement |
|---|---|---|---|---|
| 2024 | $2,008 | $330,120 | $33,000 | $297,120 |
| 2023 | $2,008 | $330,120 | $33,000 | $297,120 |
| 2022 | $1,522 | $232,930 | $21,000 | $211,930 |
| 2021 | $1,518 | $232,930 | $21,000 | $211,930 |
| 2020 | $1,518 | $232,930 | $21,000 | $211,930 |
| 2019 | $1,494 | $232,930 | $21,000 | $211,930 |
| 2018 | $1,286 | $206,570 | $22,000 | $184,570 |
| 2017 | $1,286 | $206,570 | $22,000 | $184,570 |
| 2016 | $1,286 | $206,570 | $22,000 | $184,570 |
| 2015 | $1,286 | $206,570 | $22,000 | $184,570 |
| 2014 | $1,252 | $216,270 | $22,000 | $194,270 |
Source: Public Records
Map
Nearby Homes
- 121 Wildeman Trail
- 198 Dunlap Loop
- TBD Addie Rd
- 129 Renaissance Place
- 257 Donsdale Dr
- 250 Donsdale Dr
- 192 Baymount Dr
- 00000 Barnyard Ln
- 784 Whites Farm Rd
- 105 Saddlewood Ln
- 475 Baymount Dr
- 202 Deitz Rd
- 587 Jane Sowers Rd
- 2 Whites Farm Rd
- 131 Little Forest Ln
- 173 Chestnut Grove Rd
- 118 Cypress Acres Ln
- 103 Oaklawn Rd
- 1018 Jennings Rd
- 116 Green Meadow Ln
- 120 Sandalwood Ln
- 115 Sandalwood Ln
- Lot 24 Sandalwood Ln
- L30 Sandalwood Ln Unit 30
- L40 Sandalwood Ln Unit 40
- L29,30 Sandalwood Ln Unit 29 30
- L29,30 Sandalwood Ln
- L23 Sandalwood Ln Unit 23
- L29 Sandalwood Ln
- L41 Sandalwood Ln Unit 41
- 121 Sandalwood Ln
- 34 Lone Poplar Dr
- 124 Ravencrest Dr Unit 1
- 124 Ravencrest Dr
- L33 Lone Poplar Dr Unit 33
- 207 Maple Creek Dr
- 33 Lone Poplar Dr
- L34 Lone Poplar Ln Unit 34
- 213 Maple Creek Dr Unit 38
- 138 Ravencrest Dr