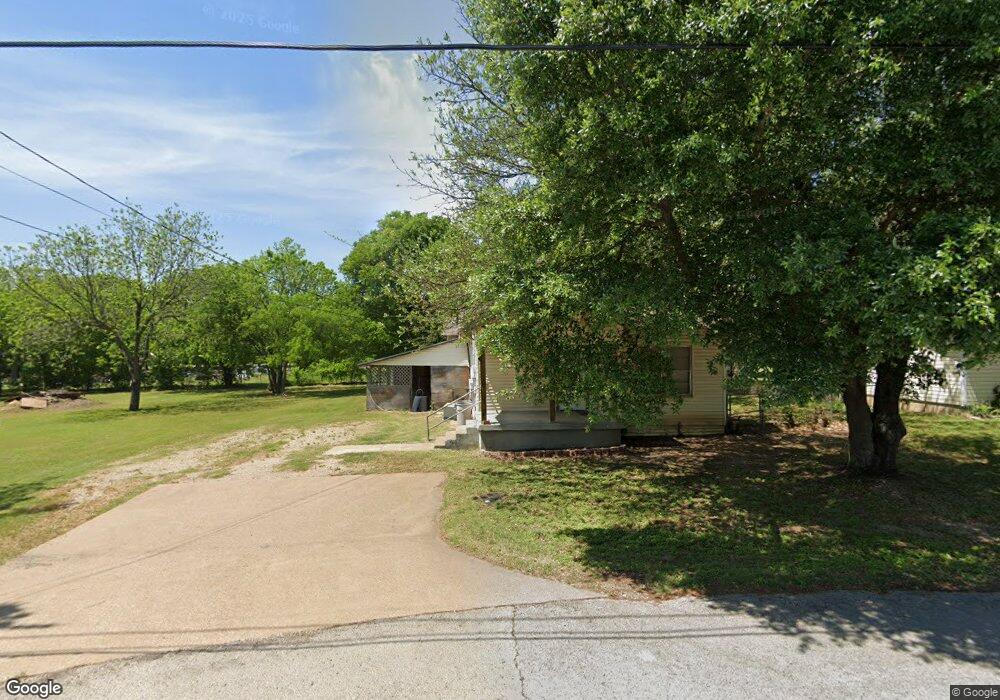
112 Sewell Ave Midlothian, TX 76065
Estimated Value: $230,000 - $235,672
3
Beds
1
Bath
1,208
Sq Ft
$193/Sq Ft
Est. Value
About This Home
This home is located at 112 Sewell Ave, Midlothian, TX 76065 and is currently estimated at $232,836, approximately $192 per square foot. 112 Sewell Ave is a home located in Ellis County with nearby schools including Irvin Elementary School and Frank Seale Middle School.
Ownership History
Date
Name
Owned For
Owner Type
Purchase Details
Closed on
Jul 30, 2025
Sold by
Swiney Shane E and Swiney Paula L
Bought by
Mcgehee Freddie
Current Estimated Value
Home Financials for this Owner
Home Financials are based on the most recent Mortgage that was taken out on this home.
Original Mortgage
$140,000
Outstanding Balance
$139,881
Interest Rate
6.81%
Mortgage Type
New Conventional
Estimated Equity
$92,955
Create a Home Valuation Report for This Property
The Home Valuation Report is an in-depth analysis detailing your home's value as well as a comparison with similar homes in the area
Home Values in the Area
Average Home Value in this Area
Purchase History
| Date | Buyer | Sale Price | Title Company |
|---|---|---|---|
| Mcgehee Freddie | -- | None Listed On Document |
Source: Public Records
Mortgage History
| Date | Status | Borrower | Loan Amount |
|---|---|---|---|
| Open | Mcgehee Freddie | $140,000 |
Source: Public Records
Tax History Compared to Growth
Tax History
| Year | Tax Paid | Tax Assessment Tax Assessment Total Assessment is a certain percentage of the fair market value that is determined by local assessors to be the total taxable value of land and additions on the property. | Land | Improvement |
|---|---|---|---|---|
| 2025 | $1,009 | $137,586 | -- | -- |
| 2024 | $1,009 | $125,078 | -- | -- |
| 2023 | $1,009 | $113,707 | $0 | $0 |
| 2022 | $2,316 | $103,370 | $0 | $0 |
| 2021 | $2,224 | $101,510 | $39,380 | $62,130 |
| 2020 | $2,149 | $96,320 | $37,500 | $58,820 |
| 2019 | $2,034 | $88,060 | $0 | $0 |
| 2018 | $1,335 | $71,000 | $20,000 | $51,000 |
| 2017 | $1,709 | $66,210 | $20,000 | $46,210 |
| 2016 | $1,553 | $58,350 | $15,000 | $43,350 |
| 2015 | $1,077 | $53,700 | $15,000 | $38,700 |
| 2014 | $1,077 | $53,020 | $0 | $0 |
Source: Public Records
Map
Nearby Homes