Estimated Value: $211,473 - $224,000
3
Beds
2
Baths
1,468
Sq Ft
$149/Sq Ft
Est. Value
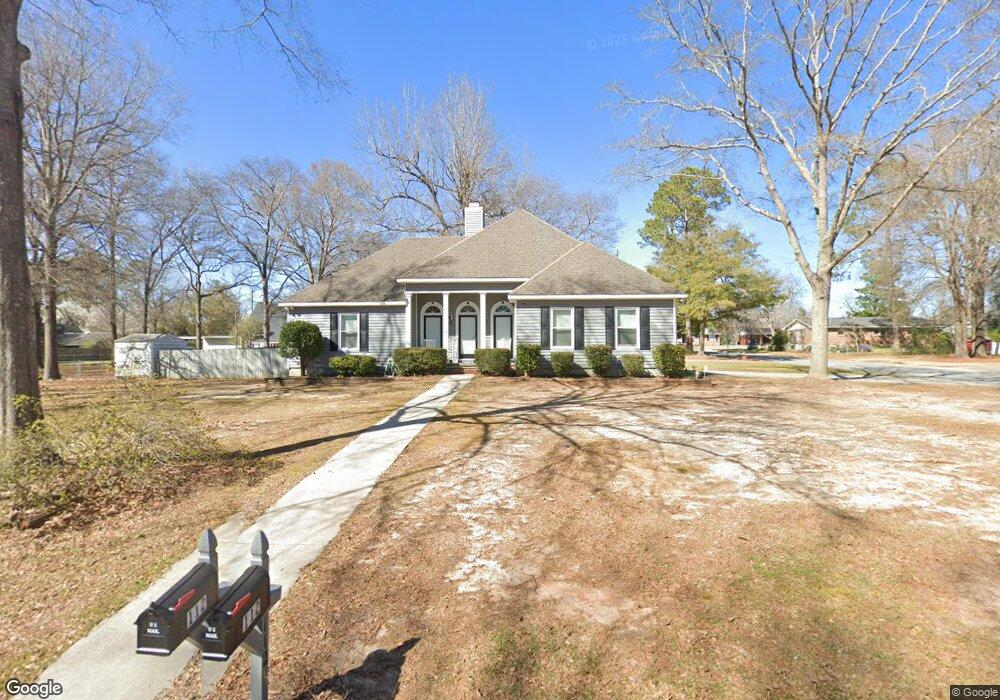
About This Home
This home is located at 112 Shane Cir, Perry, GA 31069 and is currently estimated at $219,118, approximately $149 per square foot. 112 Shane Cir is a home located in Houston County with nearby schools including Tucker Elementary School, Perry Middle School, and Perry High School.
Ownership History
Date
Name
Owned For
Owner Type
Purchase Details
Closed on
Sep 23, 2005
Sold by
Mccurdy Kyle D and Jo Ellen*
Bought by
Askew Charlie B and Wheeler Bettye L*
Current Estimated Value
Purchase Details
Closed on
Dec 22, 1995
Sold by
Mccurdy Kyle D
Bought by
Mccurdy Kyle D and Jo Ellen*
Purchase Details
Closed on
Dec 1, 1995
Sold by
Pimentel Randall P
Bought by
Mccurdy Kyle D
Purchase Details
Closed on
Aug 31, 1993
Sold by
Hackworth Benjamin Patrick
Bought by
Pimentel Randall P
Purchase Details
Closed on
Jun 16, 1993
Sold by
Hood Demetria
Bought by
Hackworth Benjamin Patrick
Purchase Details
Closed on
Apr 30, 1990
Sold by
Nederveld Dean and Sarah C*
Bought by
Hackworth Benjamin P and Hackworth Demetria*
Purchase Details
Closed on
Sep 30, 1988
Sold by
Stokes Real Estate Corp
Bought by
Nederveld Dean and Sarah C*
Purchase Details
Closed on
Sep 11, 1987
Sold by
Stokes W F
Bought by
Stokes Real Estate Corp
Create a Home Valuation Report for This Property
The Home Valuation Report is an in-depth analysis detailing your home's value as well as a comparison with similar homes in the area
Home Values in the Area
Average Home Value in this Area
Purchase History
| Date | Buyer | Sale Price | Title Company |
|---|---|---|---|
| Askew Charlie B | $122,000 | -- | |
| Mccurdy Kyle D | -- | -- | |
| Mccurdy Kyle D | $83,500 | -- | |
| Pimentel Randall P | -- | -- | |
| Hackworth Benjamin Patrick | -- | -- | |
| Hackworth Benjamin P | -- | -- | |
| Nederveld Dean | -- | -- | |
| Stokes Real Estate Corp | -- | -- |
Source: Public Records
Tax History
| Year | Tax Paid | Tax Assessment Tax Assessment Total Assessment is a certain percentage of the fair market value that is determined by local assessors to be the total taxable value of land and additions on the property. | Land | Improvement |
|---|---|---|---|---|
| 2025 | $2,019 | $66,480 | $10,000 | $56,480 |
| 2024 | $2,178 | $60,520 | $10,000 | $50,520 |
| 2023 | $1,826 | $50,600 | $10,000 | $40,600 |
| 2022 | $985 | $44,840 | $8,000 | $36,840 |
| 2021 | $899 | $40,880 | $8,000 | $32,880 |
| 2020 | $876 | $39,720 | $8,000 | $31,720 |
| 2019 | $876 | $39,720 | $8,000 | $31,720 |
| 2018 | $876 | $39,720 | $8,000 | $31,720 |
| 2017 | $877 | $39,720 | $8,000 | $31,720 |
| 2016 | $879 | $39,720 | $8,000 | $31,720 |
| 2015 | $880 | $39,720 | $8,000 | $31,720 |
| 2014 | -- | $39,720 | $8,000 | $31,720 |
| 2013 | -- | $39,720 | $8,000 | $31,720 |
Source: Public Records
Map
Nearby Homes
- 1423 Tucker Rd
- 528 Ansley Ave
- 614 Hillcrest Ave
- 625 Cooper St
- 634 Pine Ridge St
- 1432 Duncan Ave
- 624 Pine Ridge St
- 1207 Tucker Rd
- 117 Constance Ct
- 118 Constance Ct
- 903 Massee Ln
- 1 Pleasant Oaks Dr
- 3 Pleasant Oaks Dr
- 107 Water Run Way
- 214 Farmland Cir
- 203 Farrell Way
- 214 Farmland Cir Unit LOT 8 AG
- 4 Pleasant Oak Dr
- 2 Pleasant Oaks Dr
- 0 Carroll Aly
Your Personal Tour Guide
Ask me questions while you tour the home.