Estimated Value: $288,000 - $395,996
3
Beds
2
Baths
1,923
Sq Ft
$167/Sq Ft
Est. Value
About This Home
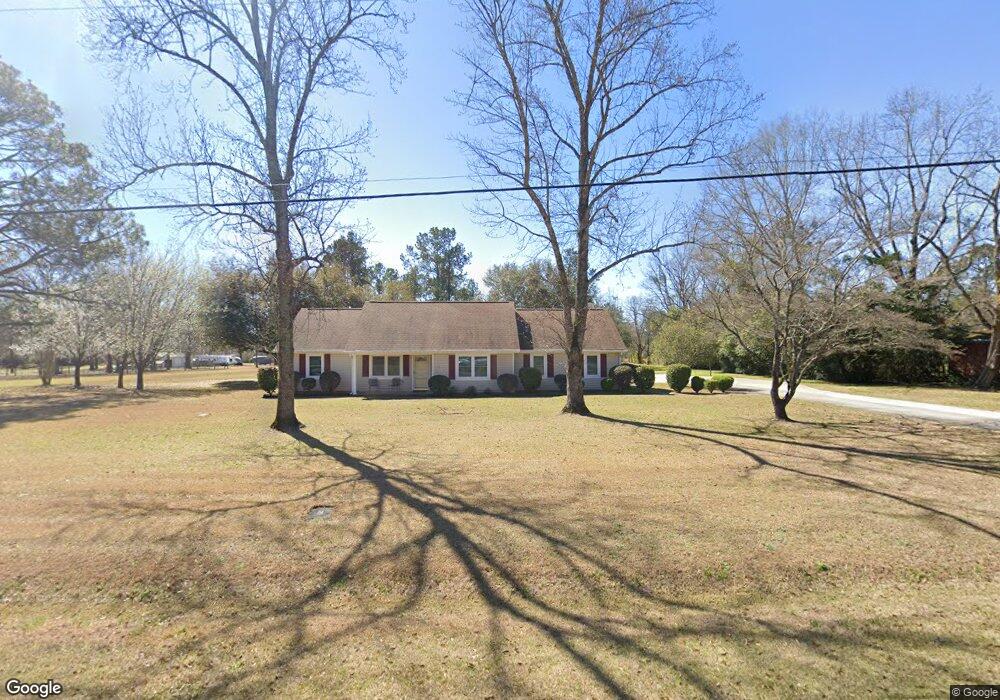
This home is located at 112 Sparrow St, Perry, GA 31069 and is currently estimated at $321,249, approximately $167 per square foot. 112 Sparrow St is a home located in Houston County with nearby schools including Langston Road Elementary School, Perry Middle School, and Perry High School.
Ownership History
Date
Name
Owned For
Owner Type
Purchase Details
Closed on
Apr 16, 2001
Sold by
Kelly Georgia M
Bought by
Johnson Larry E and Catherine L*
Current Estimated Value
Purchase Details
Closed on
Dec 22, 1997
Sold by
Nickles Paul W and Margaret L*
Bought by
Kelly Georgia M
Purchase Details
Closed on
Aug 18, 1986
Sold by
Bolin Bolin H and Bolin Susan D
Bought by
Nickles Paul W and Margaret L*
Purchase Details
Closed on
Oct 5, 1978
Sold by
Cox Roy F
Bought by
Bolin Bolin H and Bolin Susan D
Purchase Details
Closed on
Mar 25, 1978
Sold by
Preston Edwin M and Preston Marie B
Bought by
Cox Roy F
Purchase Details
Closed on
Jan 19, 1970
Sold by
Mcfarland Donald J
Bought by
Preston Edwin M and Preston Marie B
Purchase Details
Closed on
Dec 8, 1967
Sold by
Community Realty Inc
Bought by
Mcfarland Donald J
Create a Home Valuation Report for This Property
The Home Valuation Report is an in-depth analysis detailing your home's value as well as a comparison with similar homes in the area
Home Values in the Area
Average Home Value in this Area
Purchase History
| Date | Buyer | Sale Price | Title Company |
|---|---|---|---|
| Johnson Larry E | $130,000 | -- | |
| Kelly Georgia M | -- | -- | |
| Nickles Paul W | -- | -- | |
| Bolin Bolin H | -- | -- | |
| Cox Roy F | -- | -- | |
| Preston Edwin M | -- | -- | |
| Mcfarland Donald J | -- | -- |
Source: Public Records
Tax History
| Year | Tax Paid | Tax Assessment Tax Assessment Total Assessment is a certain percentage of the fair market value that is determined by local assessors to be the total taxable value of land and additions on the property. | Land | Improvement |
|---|---|---|---|---|
| 2024 | $2,138 | $98,480 | $30,800 | $67,680 |
| 2023 | $1,746 | $72,240 | $17,320 | $54,920 |
| 2022 | $1,652 | $68,360 | $17,320 | $51,040 |
| 2021 | $1,544 | $63,560 | $17,320 | $46,240 |
| 2020 | $1,534 | $62,840 | $17,320 | $45,520 |
| 2019 | $1,430 | $58,600 | $17,320 | $41,280 |
| 2018 | $1,430 | $58,600 | $17,320 | $41,280 |
| 2017 | $1,432 | $58,600 | $17,320 | $41,280 |
| 2016 | $1,434 | $58,600 | $17,320 | $41,280 |
| 2015 | $1,437 | $58,600 | $17,320 | $41,280 |
| 2014 | -- | $58,600 | $17,320 | $41,280 |
| 2013 | -- | $59,600 | $17,320 | $42,280 |
Source: Public Records
Map
Nearby Homes
- 203 Washington Place Dr
- 105 Eagles Ridge Ct
- Applause Plan at The Encore - Townhomes
- Perry Plan at The Encore - Single-Family
- Warner Plan at The Encore - Single-Family
- Colbert Plan at The Encore - Single-Family
- Centerville Plan at The Encore - Single-Family
- 102 N Haven Ln
- 204 Blue Heron Dr
- 105 Prospect Ave
- 109 Billboard Ave
- 109 Prospect Ave
- 111 Prospect Ave
- 238 Lake Joy Rd
- 127 Glen Oaks Rd
- 1015 Cherokee Rd
- 1802 Houston Lake Rd
- 208 Sugarloaf Pkwy
- 1729 Milton Way
- 138 Sadie Heights Blvd
- 114 Sparrow St
- 116 Sparrow St
- 110 Sparrow St
- 104 Sparrow St
- 116 Grayton Way
- 122 Grayton Way
- 120 Grayton Way
- 118 Grayton Way
- 115 Sparrow St
- 111 Sparrow St
- 200 Grayton Way
- 202 Grayton Way
- 114 Grayton Way
- 204 Grayton Way
- 206 Grayton Way
- 112 Grayton Way
- 118 Sparrow St
- 110 Grayton Way
- 108 Grayton Way Unit 27
- 208 Grayton Way