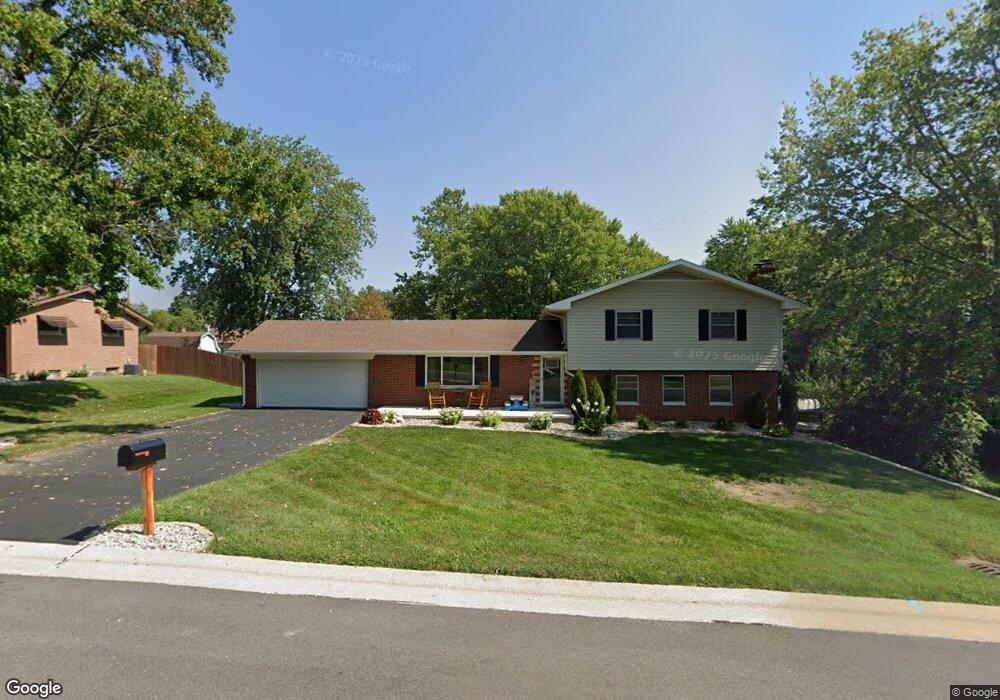
112 St Mary Dr Collinsville, IL 62234
Estimated Value: $192,000 - $252,000
4
Beds
2
Baths
2,200
Sq Ft
$98/Sq Ft
Est. Value
About This Home
This home is located at 112 St Mary Dr, Collinsville, IL 62234 and is currently estimated at $216,388, approximately $98 per square foot. 112 St Mary Dr is a home located in Madison County with nearby schools including John A Renfro Elementary School, Dorris Intermediate School, and Collinsville Middle School.
Ownership History
Date
Name
Owned For
Owner Type
Purchase Details
Closed on
Mar 31, 2021
Sold by
Newbrough Ryan
Bought by
Newbrough Michele R
Current Estimated Value
Purchase Details
Closed on
Oct 29, 2020
Sold by
Bienemann Andrew M and Yarber Alexandra L
Bought by
Newbrough Ryan
Home Financials for this Owner
Home Financials are based on the most recent Mortgage that was taken out on this home.
Original Mortgage
$123,675
Outstanding Balance
$110,427
Interest Rate
2.99%
Mortgage Type
New Conventional
Estimated Equity
$105,961
Purchase Details
Closed on
Oct 15, 2014
Sold by
Fannie Mae
Bought by
Bienemann Andrew M and Bienemann Alexandra L
Home Financials for this Owner
Home Financials are based on the most recent Mortgage that was taken out on this home.
Original Mortgage
$101,037
Interest Rate
3.87%
Mortgage Type
FHA
Purchase Details
Closed on
Oct 30, 2013
Sold by
Harris Dean C and Green Tree Servicing Llc
Bought by
Federal National Mortgage Association
Create a Home Valuation Report for This Property
The Home Valuation Report is an in-depth analysis detailing your home's value as well as a comparison with similar homes in the area
Home Values in the Area
Average Home Value in this Area
Purchase History
| Date | Buyer | Sale Price | Title Company |
|---|---|---|---|
| Newbrough Michele R | -- | None Available | |
| Newbrough Ryan | $127,500 | Illinois Real Estate Title | |
| Bienemann Andrew M | $103,000 | None Available | |
| Federal National Mortgage Association | -- | None Available |
Source: Public Records
Mortgage History
| Date | Status | Borrower | Loan Amount |
|---|---|---|---|
| Open | Newbrough Ryan | $123,675 | |
| Previous Owner | Bienemann Andrew M | $101,037 |
Source: Public Records
Tax History Compared to Growth
Tax History
| Year | Tax Paid | Tax Assessment Tax Assessment Total Assessment is a certain percentage of the fair market value that is determined by local assessors to be the total taxable value of land and additions on the property. | Land | Improvement |
|---|---|---|---|---|
| 2024 | $3,324 | $59,880 | $7,200 | $52,680 |
| 2023 | $3,324 | $55,420 | $6,660 | $48,760 |
| 2022 | $3,150 | $49,690 | $5,960 | $43,730 |
| 2021 | $2,711 | $46,680 | $5,600 | $41,080 |
| 2020 | $2,609 | $44,530 | $5,340 | $39,190 |
| 2019 | $2,537 | $43,010 | $5,160 | $37,850 |
| 2018 | $2,568 | $41,990 | $4,870 | $37,120 |
| 2017 | $2,571 | $41,150 | $4,770 | $36,380 |
| 2016 | $2,717 | $41,150 | $4,770 | $36,380 |
| 2015 | $2,526 | $40,080 | $4,650 | $35,430 |
| 2014 | $2,526 | $40,080 | $4,650 | $35,430 |
| 2013 | $2,526 | $40,080 | $4,650 | $35,430 |
Source: Public Records
Map
Nearby Homes
- 131 E Country Ln
- 2033 Mapleleaf Dr
- 112 Crestmoor St
- 19 Chelsea Rd
- 130 Hilltop Place
- 2 Chelsea Rd
- 300 Pine Lake Rd Unit 6
- 300 Pine Lake Rd Unit 7
- 102 Toni Ct
- 201 S Lange Ave
- 226 Woodridge Ct
- 912 Oakridge Dr
- 625 W Country Ln
- 1005 Daniel Dr
- 7 Keiths Ct
- 1014 Daniel Dr
- 22 Oak Valley Dr
- 1029 Andra Dr
- 1002 California Ave
- 137 W Zupan St
- 112 Saint Mary Dr
- 114 Saint Mary Dr
- 111 Saint Mary Dr
- 2516 Vandalia St
- 2602 Vandalia St
- 2514 Vandalia St
- 109 Saint Mary Dr
- 108 Saint Mary Dr
- 2512 Vandalia St
- 106 Saint Mary Dr
- 107 Saint Mary Dr
- 2606 Vandalia St
- 2510 Vandalia St
- 104 Saint Mary Dr
- 105 Saint Mary Dr
- 812 Saint Joseph Dr
- 2608 Vandalia St
- 2508 Vandalia St
- 807 Saint Joseph Dr
- 102 Saint Mary Dr