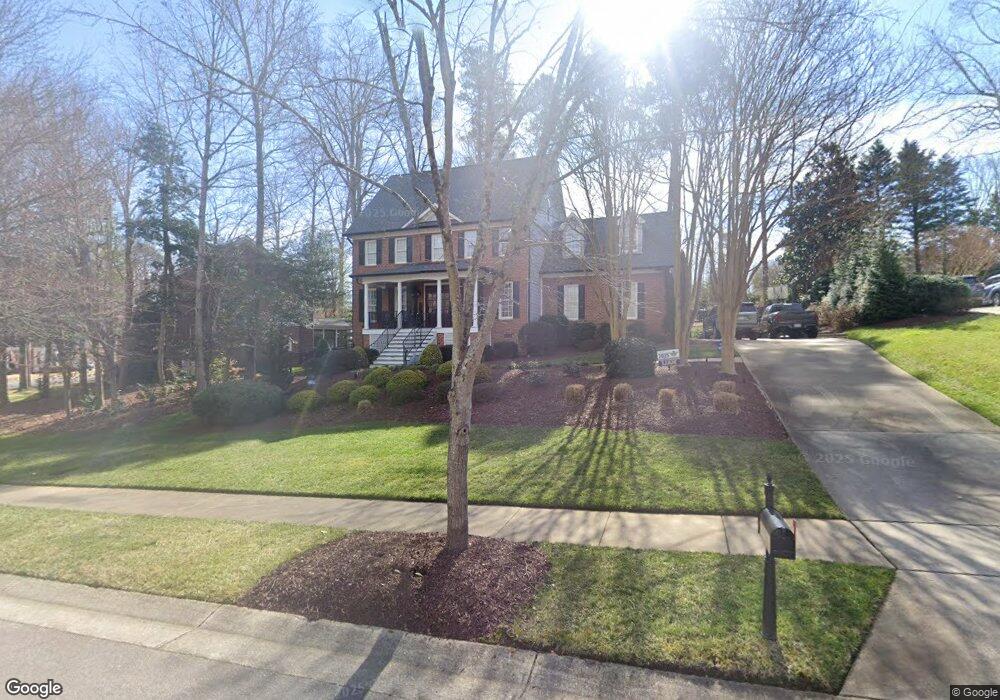
112 Starwood Ln Holly Springs, NC 27540
Estimated Value: $696,000 - $747,000
4
Beds
3
Baths
2,500
Sq Ft
$288/Sq Ft
Est. Value
About This Home
This home is located at 112 Starwood Ln, Holly Springs, NC 27540 and is currently estimated at $721,194, approximately $288 per square foot. 112 Starwood Ln is a home located in Wake County with nearby schools including Holly Springs Elementary School, Holly Ridge Middle School, and Holly Springs High School.
Ownership History
Date
Name
Owned For
Owner Type
Purchase Details
Closed on
Aug 28, 2018
Sold by
Greene Ronee J and Greene Jayson D
Bought by
Greene Ronee J and Greene Jayson D
Current Estimated Value
Purchase Details
Closed on
May 15, 2012
Sold by
Lynch Alexander A and Lynch Kimberly C
Bought by
Sachs Ronee J
Home Financials for this Owner
Home Financials are based on the most recent Mortgage that was taken out on this home.
Original Mortgage
$316,300
Outstanding Balance
$220,276
Interest Rate
4.01%
Mortgage Type
New Conventional
Estimated Equity
$500,918
Purchase Details
Closed on
May 19, 1999
Sold by
Colanco Company
Bought by
Lynch Alexander A and Lynch Kimberly C
Home Financials for this Owner
Home Financials are based on the most recent Mortgage that was taken out on this home.
Original Mortgage
$208,000
Interest Rate
6.87%
Purchase Details
Closed on
Mar 17, 1998
Sold by
Sunset Forest Llc
Bought by
Colanco Company
Create a Home Valuation Report for This Property
The Home Valuation Report is an in-depth analysis detailing your home's value as well as a comparison with similar homes in the area
Home Values in the Area
Average Home Value in this Area
Purchase History
| Date | Buyer | Sale Price | Title Company |
|---|---|---|---|
| Greene Ronee J | -- | None Available | |
| Sachs Ronee J | $333,000 | None Available | |
| Lynch Alexander A | $260,000 | -- | |
| Colanco Company | $99,000 | -- |
Source: Public Records
Mortgage History
| Date | Status | Borrower | Loan Amount |
|---|---|---|---|
| Open | Sachs Ronee J | $316,300 | |
| Previous Owner | Lynch Alexander A | $208,000 | |
| Closed | Lynch Alexander A | $26,000 |
Source: Public Records
Tax History Compared to Growth
Tax History
| Year | Tax Paid | Tax Assessment Tax Assessment Total Assessment is a certain percentage of the fair market value that is determined by local assessors to be the total taxable value of land and additions on the property. | Land | Improvement |
|---|---|---|---|---|
| 2025 | $5,712 | $661,379 | $140,000 | $521,379 |
| 2024 | $5,688 | $661,379 | $140,000 | $521,379 |
| 2023 | $4,614 | $425,941 | $75,000 | $350,941 |
| 2022 | $4,454 | $425,941 | $75,000 | $350,941 |
| 2021 | $4,371 | $425,941 | $75,000 | $350,941 |
| 2020 | $4,371 | $425,941 | $75,000 | $350,941 |
| 2019 | $4,272 | $353,407 | $80,000 | $273,407 |
| 2018 | $3,436 | $314,300 | $80,000 | $234,300 |
| 2017 | $3,312 | $314,300 | $80,000 | $234,300 |
| 2016 | $3,267 | $314,300 | $80,000 | $234,300 |
| 2015 | $3,322 | $314,640 | $78,000 | $236,640 |
| 2014 | -- | $314,640 | $78,000 | $236,640 |
Source: Public Records
Map
Nearby Homes
- 129 Starwood Ln
- 204 Crossway Ln
- 215 Savannah Ridge Rd Unit 215
- 305 Savannah Ridge Rd
- 0/416 Holly Springs Rd
- 112 Midden Way
- 4809 Greenpoint Ln
- 201 Seagraves Creek Ln
- 204 Seagraves Creek Ln
- 200 Seagraves Creek Ln
- 113 Seagraves Creek Ln
- 124 Seagraves Creek Ln
- 120 Seagraves Creek Ln
- 116 Seagraves Creek Ln
- 155 Writing Rock Place
- 157 Writing Rock Place
- 114 Pleasant Glen Ln
- 228 Masden Rd
- 103 Pleasant Glen Ln
- 5620 Lockley Rd
- 108 Starwood Ln
- 116 Starwood Ln
- 113 Ontario Place
- 117 Starwood Ln
- 109 Ontario Place
- 117 Ontario Place
- 104 Starwood Ln
- 125 Starwood Ln
- 109 Starwood Ln
- 105 Ontario Place
- 113 Starwood Ln
- 113 Starwood Ln Unit 202
- 100 Starwood Ln
- 105 Starwood Ln
- 133 Starwood Ln
- 101 Ontario Place
- 112 Ontario Place
- 108 Ontario Place
- 137 Starwood Ln
- 116 Ontario Place