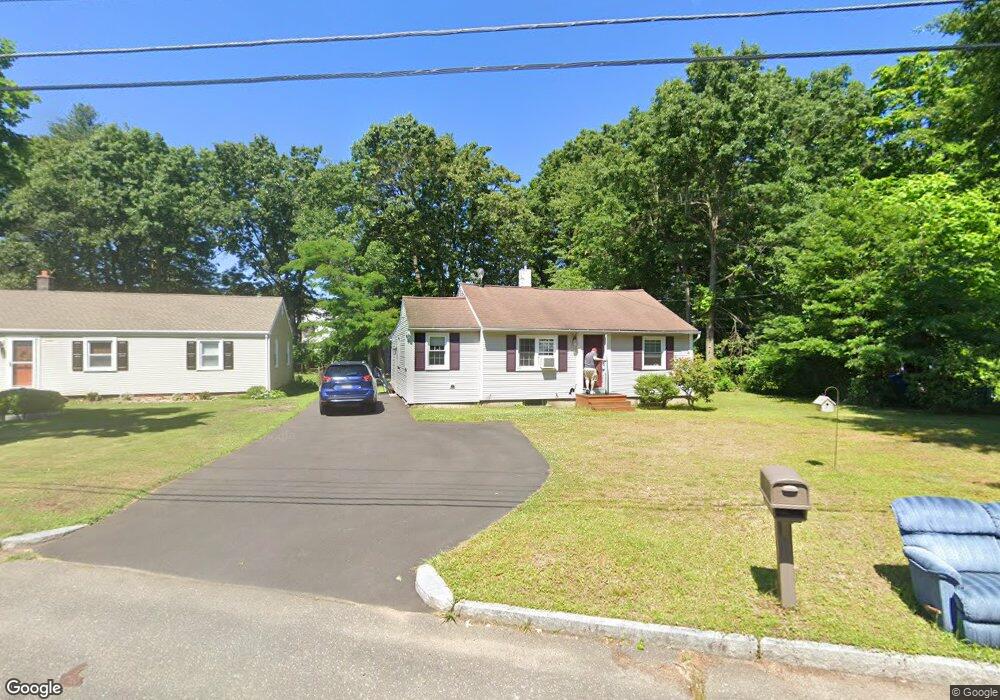
112 Stuart St Springfield, MA 01119
Pine Point NeighborhoodEstimated Value: $257,000 - $271,937
2
Beds
1
Bath
1,024
Sq Ft
$259/Sq Ft
Est. Value
About This Home
This home is located at 112 Stuart St, Springfield, MA 01119 and is currently estimated at $265,234, approximately $259 per square foot. 112 Stuart St is a home located in Hampden County with nearby schools including Frank H. Freedman School, John F. Kennedy Academy, and Springfield Central High School.
Ownership History
Date
Name
Owned For
Owner Type
Purchase Details
Closed on
Aug 26, 2005
Sold by
Babineau Peter C and Babineau Maureen E
Bought by
Gendreau Andrew J and Gendreau Jill M
Current Estimated Value
Home Financials for this Owner
Home Financials are based on the most recent Mortgage that was taken out on this home.
Original Mortgage
$105,600
Outstanding Balance
$55,891
Interest Rate
5.68%
Mortgage Type
Purchase Money Mortgage
Estimated Equity
$209,343
Purchase Details
Closed on
Apr 29, 1994
Sold by
Ludlow Sb
Bought by
Babineau Peter S and Babineau Maureen E
Home Financials for this Owner
Home Financials are based on the most recent Mortgage that was taken out on this home.
Original Mortgage
$55,000
Interest Rate
7.7%
Mortgage Type
Purchase Money Mortgage
Purchase Details
Closed on
Feb 14, 1994
Sold by
Cummings Robert G
Bought by
Ludlow Sb
Create a Home Valuation Report for This Property
The Home Valuation Report is an in-depth analysis detailing your home's value as well as a comparison with similar homes in the area
Home Values in the Area
Average Home Value in this Area
Purchase History
| Date | Buyer | Sale Price | Title Company |
|---|---|---|---|
| Gendreau Andrew J | $132,000 | -- | |
| Babineau Peter S | $55,000 | -- | |
| Ludlow Sb | $35,000 | -- |
Source: Public Records
Mortgage History
| Date | Status | Borrower | Loan Amount |
|---|---|---|---|
| Open | Gendreau Andrew J | $105,600 | |
| Previous Owner | Ludlow Sb | $56,100 | |
| Previous Owner | Ludlow Sb | $55,000 | |
| Previous Owner | Ludlow Sb | $250,000 |
Source: Public Records
Tax History Compared to Growth
Tax History
| Year | Tax Paid | Tax Assessment Tax Assessment Total Assessment is a certain percentage of the fair market value that is determined by local assessors to be the total taxable value of land and additions on the property. | Land | Improvement |
|---|---|---|---|---|
| 2025 | $3,230 | $206,000 | $39,900 | $166,100 |
| 2024 | $3,318 | $206,600 | $39,900 | $166,700 |
| 2023 | $3,468 | $203,400 | $35,300 | $168,100 |
| 2022 | $3,250 | $172,700 | $33,000 | $139,700 |
| 2021 | $3,043 | $161,000 | $30,000 | $131,000 |
| 2020 | $2,689 | $137,700 | $30,000 | $107,700 |
| 2019 | $2,397 | $121,800 | $31,000 | $90,800 |
| 2018 | $2,454 | $124,700 | $31,000 | $93,700 |
| 2017 | $2,381 | $121,100 | $34,200 | $86,900 |
| 2016 | $2,330 | $118,500 | $34,200 | $84,300 |
| 2015 | $2,262 | $115,000 | $34,200 | $80,800 |
Source: Public Records
Map
Nearby Homes
- 19 Emily St
- 523 Boston Rd
- 108 Barre St
- 54 Bernard St
- 99 Massreco St
- 78 Massreco St
- 42 Geneva St
- 195 Almira Rd
- 34 Wallace St
- 39 Wallace St
- 49 Mohegan Ave
- 37 Champlain Ave
- 99 Rosewell St
- 270 Berkshire Ave
- 54 Seymour Ave
- 224 Berkshire Ave
- 181 Marsden St
- 200 Slater Ave
- 70 Shumway St Unit 29
- 70 Shumway St Unit A1