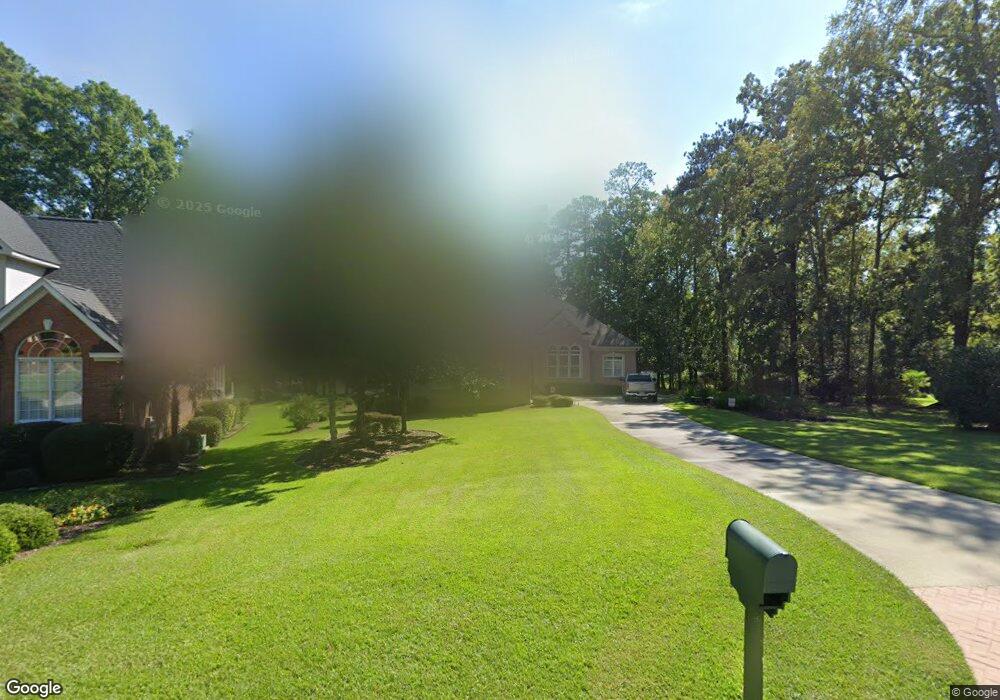
112 Summit Point Ct Chapin, SC 29036
Estimated Value: $753,000 - $1,069,000
4
Beds
3
Baths
3,021
Sq Ft
$295/Sq Ft
Est. Value
About This Home
This home is located at 112 Summit Point Ct, Chapin, SC 29036 and is currently estimated at $890,705, approximately $294 per square foot. 112 Summit Point Ct is a home located in Lexington County with nearby schools including Chapin Elementary School, Chapin Intermediate, and Chapin High School.
Ownership History
Date
Name
Owned For
Owner Type
Purchase Details
Closed on
Oct 29, 2014
Sold by
Chick William A and Chick Constance M
Bought by
Shock James M and Blair Sheri Rose
Current Estimated Value
Purchase Details
Closed on
Aug 30, 2012
Sold by
Robinson William T
Bought by
Shock James M and Blair Sheri Rose
Home Financials for this Owner
Home Financials are based on the most recent Mortgage that was taken out on this home.
Original Mortgage
$200,000
Interest Rate
2.62%
Mortgage Type
New Conventional
Purchase Details
Closed on
Oct 14, 2005
Sold by
Parker Caroline M
Bought by
Robinson William T and Robinson Barbara L
Create a Home Valuation Report for This Property
The Home Valuation Report is an in-depth analysis detailing your home's value as well as a comparison with similar homes in the area
Home Values in the Area
Average Home Value in this Area
Purchase History
| Date | Buyer | Sale Price | Title Company |
|---|---|---|---|
| Shock James M | $10,000 | -- | |
| Shock James M | $455,000 | -- | |
| Robinson William T | $559,999 | -- |
Source: Public Records
Mortgage History
| Date | Status | Borrower | Loan Amount |
|---|---|---|---|
| Previous Owner | Shock James M | $200,000 |
Source: Public Records
Tax History
| Year | Tax Paid | Tax Assessment Tax Assessment Total Assessment is a certain percentage of the fair market value that is determined by local assessors to be the total taxable value of land and additions on the property. | Land | Improvement |
|---|---|---|---|---|
| 2024 | $3,073 | $20,899 | $7,200 | $13,699 |
| 2023 | $2,806 | $20,899 | $7,200 | $13,699 |
| 2020 | $2,985 | $20,899 | $7,200 | $13,699 |
| 2019 | $2,605 | $18,266 | $5,880 | $12,386 |
| 2018 | $2,287 | $18,266 | $5,880 | $12,386 |
| 2017 | $2,224 | $18,266 | $5,880 | $12,386 |
| 2016 | $2,130 | $17,184 | $5,880 | $11,304 |
| 2014 | $2,272 | $18,198 | $6,400 | $11,798 |
| 2013 | -- | $18,200 | $6,400 | $11,800 |
Source: Public Records
Map
Nearby Homes
- 201 Edgewood Dr
- 124 Quiet Cove Dr
- 329 Oxenbridge Way
- 126 Lake Summit Dr
- 110 Lake Summit Dr
- 433 Oxenbridge Way
- 429 Oxenbridge Way
- 104 Bay Pointe Dr
- 417 Oxenbridge Way
- 248 Laurelbrook Dr
- 117 Bay Pointe Dr
- 256 Laurelbrook Dr
- 404 Jasmine Key Ln
- 120 Magnolia Key Dr
- 604 Wisteria Key Place
- 506 Timberlake Dr
- 249 Pointe Overlook Dr
- 115 Pointe Overlook Dr
- 0 Shamrock Ct Unit 617155
- 112 Water Links Dr
- 116 Summit Point Ct
- 104 Summit Point Ct
- 120 Summit Point Ct
- 109 Summit Point Ct
- 124 Summit Point Ct
- 200 Edgewood Dr
- 128 Edgewood Dr
- 128 Summit Point Ct
- 139 Edgewood Dr
- 147 Edgewood Dr
- 135 Edgewood Dr
- 151 Edgewood Dr
- 155 Edgewood Dr
- 117 Summit Point Ct
- 208 Edgewood Dr
- 241 Lake Summit Ct
- 242 Lake Summit Ct
- 132 Summit Point Ct
- 124 Edgewood Dr
- 205 Edgewood Dr
Your Personal Tour Guide
Ask me questions while you tour the home.