Estimated Value: $377,664 - $403,000
3
Beds
2
Baths
1,502
Sq Ft
$258/Sq Ft
Est. Value
About This Home
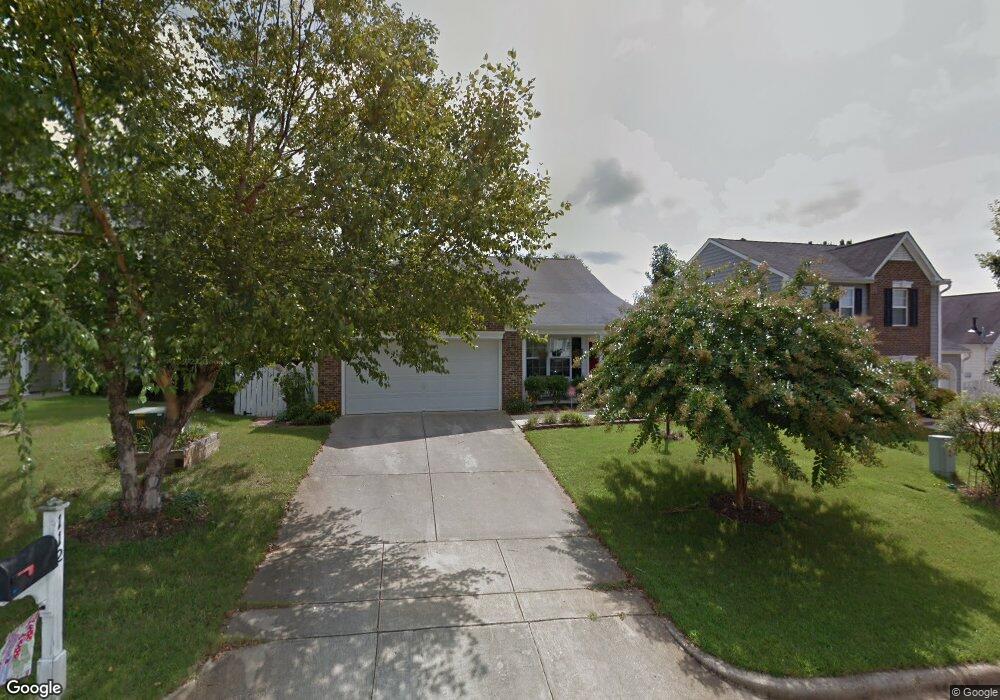
This home is located at 112 Sunshine Crest Ct, Apex, NC 27539 and is currently estimated at $386,916, approximately $257 per square foot. 112 Sunshine Crest Ct is a home located in Wake County with nearby schools including Lufkin Road Middle School, Apex Friendship High School, and Pine Springs Prep Academy.
Ownership History
Date
Name
Owned For
Owner Type
Purchase Details
Closed on
Sep 28, 2009
Sold by
Smith Susan E
Bought by
Hall Vicki J
Current Estimated Value
Home Financials for this Owner
Home Financials are based on the most recent Mortgage that was taken out on this home.
Original Mortgage
$100,000
Interest Rate
4.68%
Mortgage Type
New Conventional
Purchase Details
Closed on
Nov 23, 2004
Sold by
Talbot Ryan G and Paszt Kelly D
Bought by
Smith Susan E
Home Financials for this Owner
Home Financials are based on the most recent Mortgage that was taken out on this home.
Original Mortgage
$142,000
Interest Rate
5.77%
Mortgage Type
Purchase Money Mortgage
Purchase Details
Closed on
Jan 30, 2002
Sold by
D R Horton Inc Torrey
Bought by
Talbot Ryan G and Paszi Kelly D
Home Financials for this Owner
Home Financials are based on the most recent Mortgage that was taken out on this home.
Original Mortgage
$124,575
Interest Rate
7.14%
Create a Home Valuation Report for This Property
The Home Valuation Report is an in-depth analysis detailing your home's value as well as a comparison with similar homes in the area
Home Values in the Area
Average Home Value in this Area
Purchase History
| Date | Buyer | Sale Price | Title Company |
|---|---|---|---|
| Hall Vicki J | $181,000 | None Available | |
| Smith Susan E | $152,000 | -- | |
| Talbot Ryan G | $142,500 | -- |
Source: Public Records
Mortgage History
| Date | Status | Borrower | Loan Amount |
|---|---|---|---|
| Closed | Hall Vicki J | $100,000 | |
| Previous Owner | Smith Susan E | $142,000 | |
| Previous Owner | Talbot Ryan G | $124,575 |
Source: Public Records
Tax History Compared to Growth
Tax History
| Year | Tax Paid | Tax Assessment Tax Assessment Total Assessment is a certain percentage of the fair market value that is determined by local assessors to be the total taxable value of land and additions on the property. | Land | Improvement |
|---|---|---|---|---|
| 2025 | $3,280 | $373,373 | $160,000 | $213,373 |
| 2024 | $3,207 | $373,373 | $160,000 | $213,373 |
| 2023 | $2,808 | $254,158 | $70,000 | $184,158 |
| 2022 | $2,637 | $254,158 | $70,000 | $184,158 |
| 2021 | $2,536 | $254,158 | $70,000 | $184,158 |
| 2020 | $2,511 | $254,158 | $70,000 | $184,158 |
| 2019 | $2,333 | $203,657 | $62,000 | $141,657 |
| 2018 | $2,198 | $203,657 | $62,000 | $141,657 |
| 2017 | $2,046 | $203,657 | $62,000 | $141,657 |
| 2016 | $2,017 | $203,657 | $62,000 | $141,657 |
| 2015 | $1,861 | $183,281 | $42,000 | $141,281 |
| 2014 | -- | $183,281 | $42,000 | $141,281 |
Source: Public Records
Map
Nearby Homes
- 102 Spring Dove Ln
- 314 Cabana Dr
- 5712 Mosley Ave
- 108 Bella Place
- 5828 Old Smithfield Rd
- 300 Firefly Rd
- 148 Danesway Dr
- 201 Adefield Ln
- 317 Commons Dr
- 413 Hyannis Dr
- 201 Holmby Ct
- 680 Wickham Ridge Rd
- 3332 Colby Chase Dr Unit Lot 3
- 3340 Colby Chase Dr Unit Lot 2
- 825 Wickham Ridge Rd
- 5417 Bobbitt Rd
- 105 Arbor Wynds Ct
- 3906 Mc Clain St
- 1539 N Main St
- 2340 Horton Park Dr
- 110 Sunshine Crest Ct
- 200 Sunshine Crest Ct
- 108 Sunshine Crest Ct
- 202 Sunshine Crest Ct
- 507 Stonecreek Dr
- 240 Sunshine Crest Ct
- 505 Stonecreek Dr
- 509 Stonecreek Dr
- 104 Sunshine Crest Ct
- 111 Sunshine Crest Ct
- 204 Sunshine Crest Ct
- 201 Sunshine Crest Ct
- 503 Stonecreek Dr
- 109 Sunshine Crest Ct
- 999 Stone Creek Road Lot 3
- 102 Sunshine Crest Ct
- 107 Sunshine Crest Ct
- 203 Sunshine Crest Ct
- 511 Stonecreek Dr
- 206 Sunshine Crest Ct