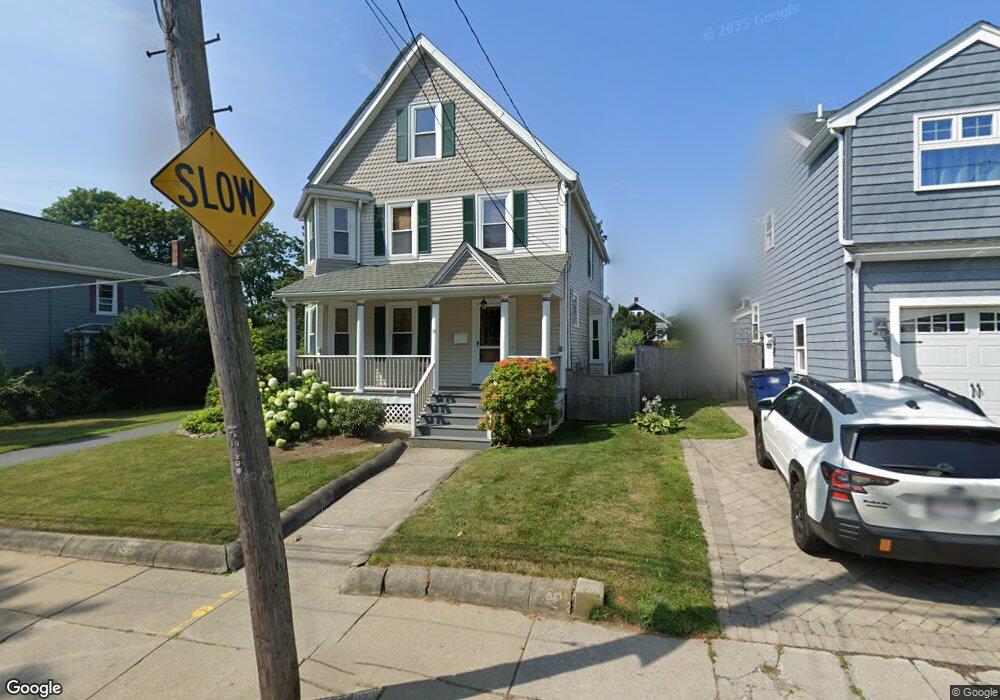
112 Temple St West Roxbury, MA 02132
West Roxbury NeighborhoodEstimated Value: $982,000 - $1,072,000
3
Beds
1
Bath
2,240
Sq Ft
$465/Sq Ft
Est. Value
About This Home
This home is located at 112 Temple St, West Roxbury, MA 02132 and is currently estimated at $1,042,046, approximately $465 per square foot. 112 Temple St is a home located in Suffolk County with nearby schools including St Theresa School, Holy Name Parish School, and Catholic Memorial School.
Ownership History
Date
Name
Owned For
Owner Type
Purchase Details
Closed on
Jun 9, 2025
Sold by
Lacro Ronald V and Schum Jon P
Bought by
Ronald V Lacro Ret and Lacro
Current Estimated Value
Purchase Details
Closed on
May 21, 2010
Sold by
Lacro Ronald V and Schum Jon P
Bought by
Lacro Ronald V and Schum Jon P
Create a Home Valuation Report for This Property
The Home Valuation Report is an in-depth analysis detailing your home's value as well as a comparison with similar homes in the area
Home Values in the Area
Average Home Value in this Area
Purchase History
| Date | Buyer | Sale Price | Title Company |
|---|---|---|---|
| Ronald V Lacro Ret | -- | None Available | |
| Ronald V Lacro Ret | -- | None Available | |
| Lacro Ronald V | -- | -- | |
| Lacro Ronald V | -- | -- |
Source: Public Records
Mortgage History
| Date | Status | Borrower | Loan Amount |
|---|---|---|---|
| Previous Owner | Lacro Ronald V | $165,000 | |
| Previous Owner | Lacro Ronald V | $218,200 | |
| Previous Owner | Lacro Ronald V | $283,000 |
Source: Public Records
Tax History Compared to Growth
Tax History
| Year | Tax Paid | Tax Assessment Tax Assessment Total Assessment is a certain percentage of the fair market value that is determined by local assessors to be the total taxable value of land and additions on the property. | Land | Improvement |
|---|---|---|---|---|
| 2025 | $10,546 | $910,700 | $291,000 | $619,700 |
| 2024 | $9,682 | $888,300 | $310,600 | $577,700 |
| 2023 | $9,088 | $846,200 | $295,900 | $550,300 |
| 2022 | $8,370 | $769,300 | $269,000 | $500,300 |
| 2021 | $7,871 | $737,700 | $263,700 | $474,000 |
| 2020 | $7,457 | $706,200 | $237,000 | $469,200 |
| 2019 | $7,087 | $672,400 | $210,000 | $462,400 |
| 2018 | $6,525 | $622,600 | $210,000 | $412,600 |
| 2017 | $6,462 | $610,200 | $210,000 | $400,200 |
| 2016 | $6,516 | $592,400 | $210,000 | $382,400 |
| 2015 | $6,344 | $523,900 | $204,000 | $319,900 |
| 2014 | $6,218 | $494,300 | $204,000 | $290,300 |
Source: Public Records
Map
Nearby Homes
- 14 Sanborn Ave
- 73 Dent St Unit 1
- 27-29 Temple St
- 183 Temple St
- 59 Chesbrough Rd
- 28 Dow Rd
- 425 Lagrange St Unit 203
- 340 Baker St Unit 1
- 539 Lagrange St
- 76 Potomac St
- 105 Chesbrough Rd
- 348 Lagrange St
- 54 Sturges Rd
- 1214 Vfw Pkwy Unit 30
- 1214 Vfw Pkwy Unit 37
- 331 Vermont St
- 63 Johnson St
- 9 Carroll St
- 110 Park St Unit 3
- 2231 Centre St
- 106 Temple St
- 120 Temple St
- 37 Sanborn Ave
- 41 Sanborn Ave
- 98 Temple St
- 98 Temple St Unit n/a
- 33 Sanborn Ave Unit 35
- 33 Sanborn Ave Unit 1
- 47 Sanborn Ave
- 35 Sanborn Ave Unit 2
- 124 Temple St
- 115 Temple St
- 29 Sanborn Ave Unit 31
- 119 Temple St
- 96 Temple St
- 107 Temple St
- 107 Temple St Unit 107
- 31 Sanborn Ave Unit 1
- 51 Sanborn Ave
- 121 Temple St