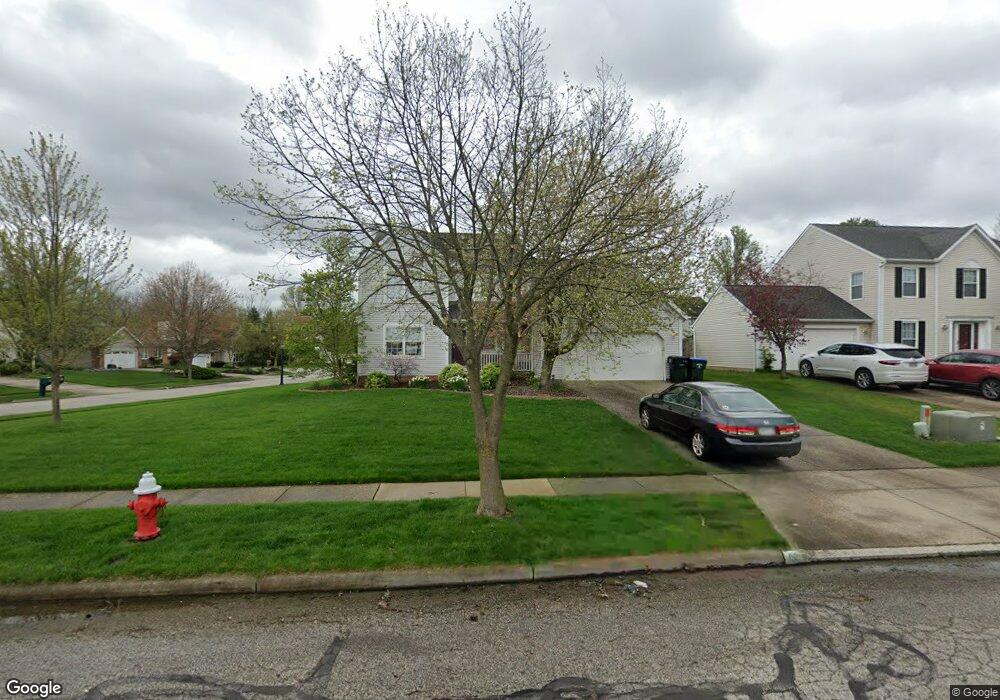
112 Timothy Ave Cuyahoga Falls, OH 44223
Mud Brook NeighborhoodEstimated Value: $386,000 - $425,000
4
Beds
4
Baths
2,652
Sq Ft
$155/Sq Ft
Est. Value
About This Home
This home is located at 112 Timothy Ave, Cuyahoga Falls, OH 44223 and is currently estimated at $412,019, approximately $155 per square foot. 112 Timothy Ave is a home located in Summit County with nearby schools including Woodridge Middle School, Woodridge High School, and Immaculate Heart Of Mary School.
Ownership History
Date
Name
Owned For
Owner Type
Purchase Details
Closed on
Apr 10, 2003
Sold by
Maupin Daniel L
Bought by
Karlo Scott A and Colleen Karlo J
Current Estimated Value
Home Financials for this Owner
Home Financials are based on the most recent Mortgage that was taken out on this home.
Original Mortgage
$153,650
Outstanding Balance
$66,056
Interest Rate
5.76%
Estimated Equity
$345,963
Purchase Details
Closed on
Feb 11, 2001
Sold by
Passeos Ernest N and Passeos Lorrie A
Bought by
Maupin Daniel L
Home Financials for this Owner
Home Financials are based on the most recent Mortgage that was taken out on this home.
Original Mortgage
$154,800
Interest Rate
7.18%
Purchase Details
Closed on
Aug 15, 1997
Sold by
Whitlatch & Co
Bought by
Passeos Ernest M and Passeos Lorrie A
Home Financials for this Owner
Home Financials are based on the most recent Mortgage that was taken out on this home.
Original Mortgage
$163,800
Interest Rate
7.71%
Mortgage Type
New Conventional
Create a Home Valuation Report for This Property
The Home Valuation Report is an in-depth analysis detailing your home's value as well as a comparison with similar homes in the area
Home Values in the Area
Average Home Value in this Area
Purchase History
| Date | Buyer | Sale Price | Title Company |
|---|---|---|---|
| Karlo Scott A | $204,900 | Falls Title Agency Inc | |
| Maupin Daniel L | $193,500 | Endress/Lawyers Title | |
| Passeos Ernest M | $182,000 | -- |
Source: Public Records
Mortgage History
| Date | Status | Borrower | Loan Amount |
|---|---|---|---|
| Open | Karlo Scott A | $153,650 | |
| Closed | Maupin Daniel L | $154,800 | |
| Previous Owner | Passeos Ernest M | $163,800 | |
| Closed | Karlo Scott A | $40,950 |
Source: Public Records
Tax History Compared to Growth
Tax History
| Year | Tax Paid | Tax Assessment Tax Assessment Total Assessment is a certain percentage of the fair market value that is determined by local assessors to be the total taxable value of land and additions on the property. | Land | Improvement |
|---|---|---|---|---|
| 2025 | $7,069 | $119,599 | $22,561 | $97,038 |
| 2024 | $7,069 | $119,599 | $22,561 | $97,038 |
| 2023 | $7,069 | $119,599 | $22,561 | $97,038 |
| 2022 | $5,929 | $89,250 | $16,835 | $72,415 |
| 2021 | $5,982 | $89,250 | $16,835 | $72,415 |
| 2020 | $5,909 | $89,260 | $16,840 | $72,420 |
| 2019 | $5,650 | $78,850 | $16,500 | $62,350 |
| 2018 | $5,750 | $78,850 | $16,500 | $62,350 |
| 2017 | $5,145 | $78,850 | $16,500 | $62,350 |
| 2016 | $5,122 | $73,650 | $16,500 | $57,150 |
| 2015 | $5,145 | $73,650 | $16,500 | $57,150 |
| 2014 | $4,849 | $73,650 | $16,500 | $57,150 |
| 2013 | $4,774 | $72,580 | $16,500 | $56,080 |
Source: Public Records
Map
Nearby Homes
- 3429 Brookpoint Ln
- 3254 Cherie Cercle
- 435 W Heritage Dr Unit 25
- 3164 Old Mill Dr
- 3168 Old Mill Dr
- 336 Graham Rd
- 377 Pleasant Meadow Blvd Unit 1D
- 3154 Prior Dr
- 154 Michael Ln
- 3452 Wyoga Lake Rd
- 3106 Prior Dr
- 3119 Meier Place
- 1531 Silver Lake Ave
- 1977 Fox Trace Trail
- 3584 Brookside Rd
- 1983 Fox Trace Trail
- 3751 Wyoga Lake Rd
- 324 Madison Ave
- 418 Hayes Ave
- 2876 9th St
- 106 Timothy Ave
- 111 Paddison Ave
- 98 Timothy Ave
- 103 Paddison Ave
- 113 Timothy Ave
- 3337 Kube St
- 3331 Kube St
- 117 Timothy Ave
- 101 Timothy Ave
- 97 Paddison Ave
- 92 Timothy Ave
- 3345 Kube St
- 3323 Kube St
- 99 Timothy Ave
- 123 Timothy Ave
- 89 Paddison Ave
- 86 Timothy Ave
- 91 Timothy Ave
- 122 Paddison Ave
- 116 Paddison Ave