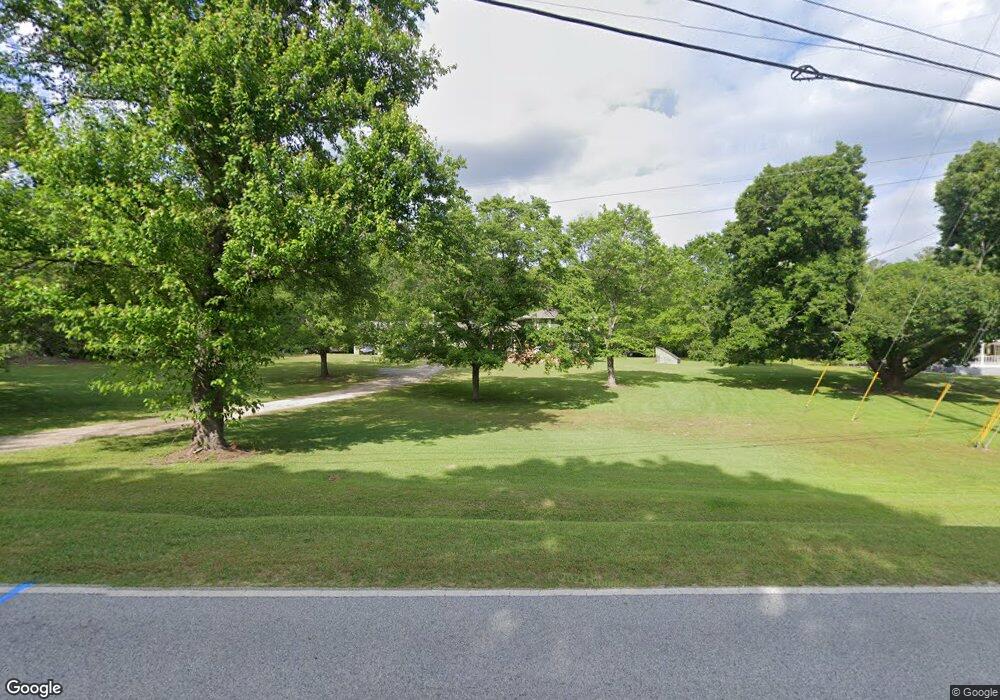
112 Vaughn Rd Griffin, GA 30223
Spalding County NeighborhoodEstimated Value: $220,000 - $384,000
3
Beds
4
Baths
1,836
Sq Ft
$156/Sq Ft
Est. Value
About This Home
This home is located at 112 Vaughn Rd, Griffin, GA 30223 and is currently estimated at $286,841, approximately $156 per square foot. 112 Vaughn Rd is a home located in Spalding County with nearby schools including Orrs Elementary School, Carver Road Middle School, and Griffin High School.
Ownership History
Date
Name
Owned For
Owner Type
Purchase Details
Closed on
Apr 4, 2018
Sold by
Crawley Eddie B
Bought by
Crawley Eddie B
Current Estimated Value
Home Financials for this Owner
Home Financials are based on the most recent Mortgage that was taken out on this home.
Original Mortgage
$104,800
Outstanding Balance
$61,524
Interest Rate
4.4%
Mortgage Type
New Conventional
Estimated Equity
$225,317
Purchase Details
Closed on
Aug 14, 2001
Sold by
Mertens Ernest L
Bought by
Crawley Eddie B and Crawley Angela D
Home Financials for this Owner
Home Financials are based on the most recent Mortgage that was taken out on this home.
Original Mortgage
$136,422
Interest Rate
7.19%
Mortgage Type
FHA
Purchase Details
Closed on
Jan 26, 1979
Sold by
Ridgeway Emily Y and Ridgeway Charles E
Bought by
Mertens Ernest L and Mertens Frances E
Purchase Details
Closed on
Nov 18, 1975
Sold by
Ridgeway Emily Y
Bought by
Ridgeway Emily Y and Ridgew Charles E
Purchase Details
Closed on
Mar 2, 1967
Bought by
Ridgeway Emily Yvonne Langford
Create a Home Valuation Report for This Property
The Home Valuation Report is an in-depth analysis detailing your home's value as well as a comparison with similar homes in the area
Home Values in the Area
Average Home Value in this Area
Purchase History
| Date | Buyer | Sale Price | Title Company |
|---|---|---|---|
| Crawley Eddie B | -- | -- | |
| Crawley Eddie B | $137,500 | -- | |
| Mertens Ernest L | -- | -- | |
| Mertens Ernest L | $47,500 | -- | |
| Ridgeway Emily Y | -- | -- | |
| Ridgeway Emily Yvonne Langford | $1,700 | -- |
Source: Public Records
Mortgage History
| Date | Status | Borrower | Loan Amount |
|---|---|---|---|
| Open | Crawley Eddie B | $104,800 | |
| Previous Owner | Mertens Ernest L | $136,422 |
Source: Public Records
Tax History Compared to Growth
Tax History
| Year | Tax Paid | Tax Assessment Tax Assessment Total Assessment is a certain percentage of the fair market value that is determined by local assessors to be the total taxable value of land and additions on the property. | Land | Improvement |
|---|---|---|---|---|
| 2024 | $2,417 | $69,367 | $13,104 | $56,263 |
| 2023 | $2,417 | $69,367 | $13,104 | $56,263 |
| 2022 | $2,033 | $57,728 | $8,736 | $48,992 |
| 2021 | $1,813 | $51,655 | $8,736 | $42,919 |
| 2020 | $1,819 | $51,655 | $8,736 | $42,919 |
| 2019 | $1,692 | $47,272 | $8,736 | $38,536 |
| 2018 | $1,612 | $43,987 | $8,736 | $35,251 |
| 2017 | $1,568 | $43,987 | $8,736 | $35,251 |
| 2016 | $1,596 | $43,987 | $8,736 | $35,251 |
| 2015 | $1,645 | $43,987 | $8,736 | $35,251 |
| 2014 | -- | $43,987 | $8,736 | $35,251 |
Source: Public Records
Map
Nearby Homes
- 135 Vaughn Rd
- 230 Vaughn Rd
- 3861 Newnan Rd
- 3890 Newnan Rd
- 118 Jacqueline Dr
- 103 Jacqueline Dr
- 3 ACRES Anderson Rd
- 0 Newnan Rd Unit 10550410
- 146 Rivers Rd
- 364 Yarbrough Mill Rd
- 2317 W Ellis Rd
- 127 Canaan Ct
- 90 & 212 Kendall Dr
- 502 N Rover Rd
- 474 N Rover Rd
- 184 Quail Rd
- 329 Maloy Rd
- 0 Maloy Rd Unit 7407276
- 0 Maloy Rd Unit 10322485
- 200 Ac W Ellis Rd