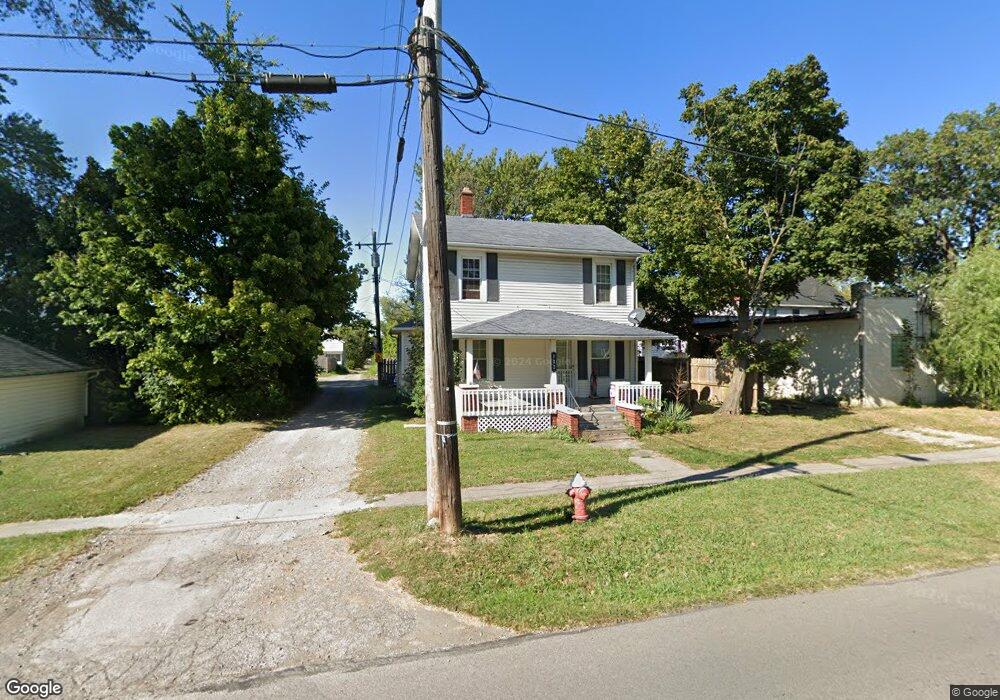
112 W 34th St Lorain, OH 44055
Estimated Value: $104,579 - $120,000
3
Beds
1
Bath
1,092
Sq Ft
$102/Sq Ft
Est. Value
About This Home
This home is located at 112 W 34th St, Lorain, OH 44055 and is currently estimated at $110,895, approximately $101 per square foot. 112 W 34th St is a home located in Lorain County with nearby schools including Garfield Elementary School, Southview Middle School, and Lorain High School.
Ownership History
Date
Name
Owned For
Owner Type
Purchase Details
Closed on
Aug 12, 2017
Sold by
Akin Joseph Allen and Akin Deborah
Bought by
Loomis Properties Llc
Current Estimated Value
Home Financials for this Owner
Home Financials are based on the most recent Mortgage that was taken out on this home.
Original Mortgage
$42,000
Outstanding Balance
$34,970
Interest Rate
3.88%
Mortgage Type
New Conventional
Estimated Equity
$75,925
Purchase Details
Closed on
Jul 30, 2008
Sold by
Deutsche Bank National Trust Co
Bought by
Akin Joseph Allen
Purchase Details
Closed on
Sep 4, 2007
Sold by
Okeefe Patricia A
Bought by
Deutsche Bank National Trust Co and Certificateholders Of Ffmlt Trust 2005-F
Purchase Details
Closed on
Nov 30, 1995
Sold by
Waters Kenneth E
Bought by
O'Keefe Patricia A
Home Financials for this Owner
Home Financials are based on the most recent Mortgage that was taken out on this home.
Original Mortgage
$44,938
Interest Rate
7.44%
Mortgage Type
FHA
Create a Home Valuation Report for This Property
The Home Valuation Report is an in-depth analysis detailing your home's value as well as a comparison with similar homes in the area
Home Values in the Area
Average Home Value in this Area
Purchase History
| Date | Buyer | Sale Price | Title Company |
|---|---|---|---|
| Loomis Properties Llc | $480,000 | -- | |
| Akin Joseph Allen | $33,900 | Attorney | |
| Deutsche Bank National Trust Co | -- | None Available | |
| O'Keefe Patricia A | $45,000 | -- |
Source: Public Records
Mortgage History
| Date | Status | Borrower | Loan Amount |
|---|---|---|---|
| Open | Loomis Properties Llc | $42,000 | |
| Previous Owner | O'Keefe Patricia A | $44,938 |
Source: Public Records
Tax History
| Year | Tax Paid | Tax Assessment Tax Assessment Total Assessment is a certain percentage of the fair market value that is determined by local assessors to be the total taxable value of land and additions on the property. | Land | Improvement |
|---|---|---|---|---|
| 2024 | $1,125 | $26,621 | $4,284 | $22,337 |
| 2023 | $1,011 | $19,142 | $3,273 | $15,869 |
| 2022 | $1,003 | $19,142 | $3,273 | $15,869 |
| 2021 | $1,002 | $19,142 | $3,273 | $15,869 |
| 2020 | $927 | $15,370 | $2,630 | $12,740 |
| 2019 | $922 | $15,370 | $2,630 | $12,740 |
| 2018 | $987 | $15,370 | $2,630 | $12,740 |
| 2017 | $1,052 | $16,540 | $2,980 | $13,560 |
| 2016 | $1,044 | $16,540 | $2,980 | $13,560 |
| 2015 | $987 | $16,540 | $2,980 | $13,560 |
| 2014 | $1,076 | $18,080 | $3,260 | $14,820 |
| 2013 | $1,068 | $18,080 | $3,260 | $14,820 |
Source: Public Records
Map
Nearby Homes
- 125 W 35th St
- 3177 Elyria Ave
- V/L Broadway Ave
- 230 W 39th St
- 3011 Caroline Ave
- 2910 Caroline Ave
- 0 Canton Ave
- 2909 Denver Ave
- 319 W 27th St
- 3825 Canton Ave
- 2613 Oakdale Ave
- 112 W 25th St
- 510 E 25th St
- 3442 Albany Ave
- 3538 Albany Ave
- 2349 Kelly Place
- 2334 Apple Ave
- 824 Highland Park Blvd
- 3116 Chris Ave
- 502 W 23rd St
- 3360 Broadway
- 3363 Livingston Ave
- 3375 Livingston Ave
- 3350 Broadway
- 3355 Livingston Ave
- 3351 Livingston Ave
- 3405 Livingston Ave
- 3410 Broadway
- 3340 Broadway
- 3343 Livingston Ave
- 3419 Livingston Ave
- 3418 Broadway
- 3335 Livingston Ave
- 3421 Livingston Ave
- 3327 Livingston Ave
- 3436 Broadway
- 3427 Livingston Ave
- 3326 Broadway
- 3403 Broadway
- 3409 Broadway
Your Personal Tour Guide
Ask me questions while you tour the home.