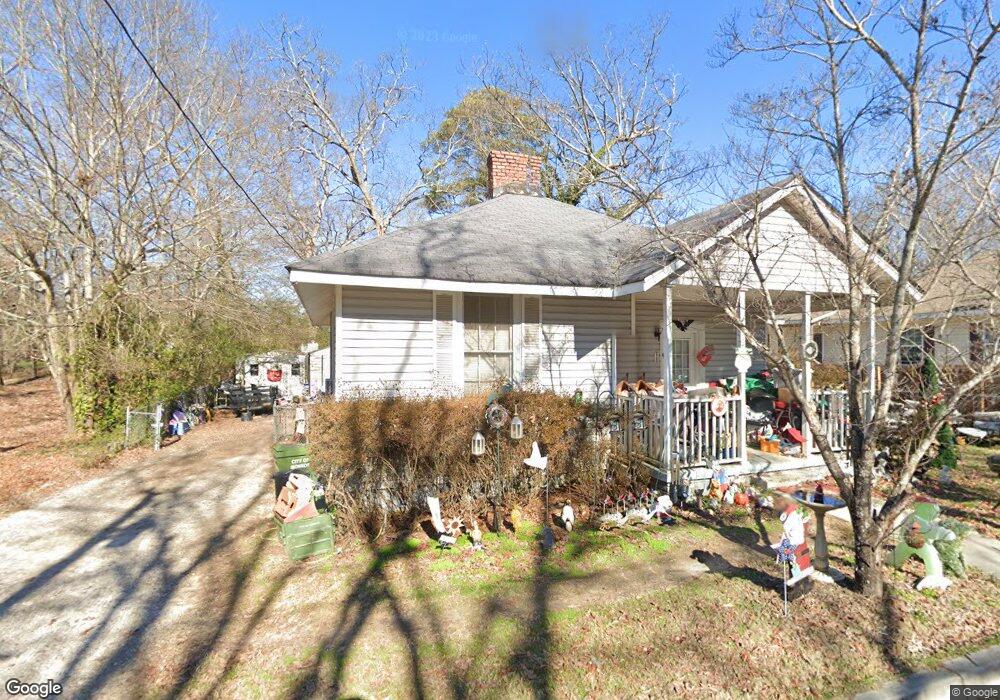
112 W 5th St Monroe, GA 30655
Estimated Value: $163,000 - $213,000
Studio
--
Bath
944
Sq Ft
$200/Sq Ft
Est. Value
About This Home
This home is located at 112 W 5th St, Monroe, GA 30655 and is currently estimated at $188,464, approximately $199 per square foot. 112 W 5th St is a home located in Walton County with nearby schools including Atha Road Elementary School, Youth Middle School, and Walnut Grove High School.
Ownership History
Date
Name
Owned For
Owner Type
Purchase Details
Closed on
Jan 3, 2018
Sold by
Millians Scott
Bought by
Stephens Ricky and Stephens Yvonne
Current Estimated Value
Home Financials for this Owner
Home Financials are based on the most recent Mortgage that was taken out on this home.
Original Mortgage
$61,000
Outstanding Balance
$23,603
Interest Rate
3.94%
Mortgage Type
New Conventional
Estimated Equity
$164,861
Purchase Details
Closed on
Aug 20, 2005
Sold by
Centex Hm Equity Co Llc
Bought by
Millians Scot
Purchase Details
Closed on
Jan 22, 2001
Sold by
Foster Ronald S
Bought by
Glass Herschel S
Home Financials for this Owner
Home Financials are based on the most recent Mortgage that was taken out on this home.
Original Mortgage
$51,801
Interest Rate
7.09%
Mortgage Type
New Conventional
Purchase Details
Closed on
May 4, 1999
Sold by
Lyndall Michael B
Bought by
Foster Ronald S
Home Financials for this Owner
Home Financials are based on the most recent Mortgage that was taken out on this home.
Original Mortgage
$33,956
Interest Rate
7%
Mortgage Type
New Conventional
Purchase Details
Closed on
Sep 19, 1995
Sold by
Bryans Norris
Bought by
Lyndall Michael B
Purchase Details
Closed on
Jul 1, 1994
Sold by
Whitlock Jean
Bought by
Blackwell Jacqueline
Create a Home Valuation Report for This Property
The Home Valuation Report is an in-depth analysis detailing your home's value as well as a comparison with similar homes in the area
Home Values in the Area
Average Home Value in this Area
Purchase History
| Date | Buyer | Sale Price | Title Company |
|---|---|---|---|
| Stephens Ricky | $62,000 | -- | |
| Millians Scot | $53,000 | -- | |
| Glass Herschel S | $53,800 | -- | |
| Foster Ronald S | $33,600 | -- | |
| Lyndall Michael B | $31,500 | -- | |
| Blackwell Jacqueline | $30,000 | -- |
Source: Public Records
Mortgage History
| Date | Status | Borrower | Loan Amount |
|---|---|---|---|
| Open | Stephens Ricky | $61,000 | |
| Previous Owner | Glass Herschel S | $51,801 | |
| Previous Owner | Foster Ronald S | $33,956 |
Source: Public Records
Tax History
| Year | Tax Paid | Tax Assessment Tax Assessment Total Assessment is a certain percentage of the fair market value that is determined by local assessors to be the total taxable value of land and additions on the property. | Land | Improvement |
|---|---|---|---|---|
| 2025 | $609 | $63,160 | $14,520 | $48,640 |
| 2024 | $1,514 | $59,320 | $12,000 | $47,320 |
| 2023 | $1,414 | $53,040 | $12,000 | $41,040 |
| 2022 | $1,289 | $43,800 | $12,000 | $31,800 |
| 2021 | $959 | $30,160 | $6,400 | $23,760 |
| 2020 | $815 | $24,320 | $4,800 | $19,520 |
| 2019 | $791 | $17,920 | $4,000 | $13,920 |
| 2018 | $706 | $17,920 | $4,000 | $13,920 |
| 2017 | $555 | $13,240 | $3,400 | $9,840 |
| 2016 | $486 | $11,800 | $3,400 | $8,400 |
| 2015 | $445 | $10,600 | $3,400 | $7,200 |
| 2014 | $418 | $9,680 | $0 | $0 |
Source: Public Records
Map
Nearby Homes
- 808 S Broad St
- 206 Walker Dr
- 212 Walker Dr
- 416 Shamrock Dr
- 529 Mill Farm Ln
- 525 Mill Farm Ln
- 1037 S Madison Ave
- 500 Mill Farm Ln
- 1230 S Madison Ave
- 223 Atha St
- 227 Atha St
- 325 Stokes St
- 404 Walker Dr
- 429 Red Oak Ct
- 1435 Creek View Dr
- 352 Davis St
- 406 Bell St
- 323 S Madison Ave
- 307 Davis St
- 167 Alcovy Springs Dr
Your Personal Tour Guide
Ask me questions while you tour the home.