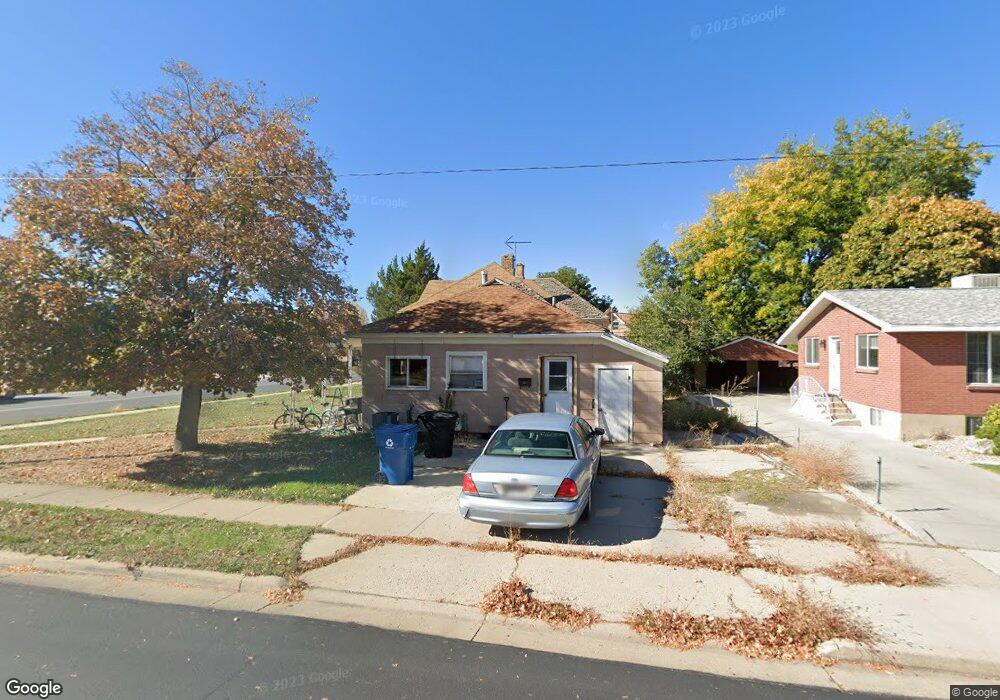
112 W 800 N Spanish Fork, UT 84660
Estimated Value: $369,898 - $426,000
2
Beds
1
Bath
1,131
Sq Ft
$342/Sq Ft
Est. Value
About This Home
This home is located at 112 W 800 N, Spanish Fork, UT 84660 and is currently estimated at $386,475, approximately $341 per square foot. 112 W 800 N is a home located in Utah County with nearby schools including Brockbank Elementary School, Spanish Fork Jr High School, and Spanish Fork High School.
Ownership History
Date
Name
Owned For
Owner Type
Purchase Details
Closed on
Apr 4, 2005
Sold by
Paxman Ronald
Bought by
Whitehead Steve and Whitehead Mary Lou
Current Estimated Value
Purchase Details
Closed on
Jan 27, 2005
Sold by
Paxman Ronald
Bought by
Whitehead Steve and Whitehead Mary Lou
Home Financials for this Owner
Home Financials are based on the most recent Mortgage that was taken out on this home.
Original Mortgage
$77,600
Interest Rate
5.87%
Mortgage Type
Adjustable Rate Mortgage/ARM
Create a Home Valuation Report for This Property
The Home Valuation Report is an in-depth analysis detailing your home's value as well as a comparison with similar homes in the area
Home Values in the Area
Average Home Value in this Area
Purchase History
| Date | Buyer | Sale Price | Title Company |
|---|---|---|---|
| Whitehead Steve | -- | Quality Title | |
| Whitehead Steve | -- | Quality Title |
Source: Public Records
Mortgage History
| Date | Status | Borrower | Loan Amount |
|---|---|---|---|
| Previous Owner | Whitehead Steve | $77,600 |
Source: Public Records
Tax History Compared to Growth
Tax History
| Year | Tax Paid | Tax Assessment Tax Assessment Total Assessment is a certain percentage of the fair market value that is determined by local assessors to be the total taxable value of land and additions on the property. | Land | Improvement |
|---|---|---|---|---|
| 2025 | $1,582 | $181,775 | $141,900 | $188,600 |
| 2024 | $1,582 | $163,075 | $0 | $0 |
| 2023 | $1,579 | $162,910 | $0 | $0 |
| 2022 | $1,650 | $167,035 | $0 | $0 |
| 2021 | $1,390 | $225,000 | $82,300 | $142,700 |
| 2020 | $1,253 | $197,200 | $68,600 | $128,600 |
| 2019 | $1,089 | $180,400 | $68,600 | $111,800 |
| 2018 | $1,036 | $165,800 | $68,600 | $97,200 |
| 2017 | $904 | $77,770 | $0 | $0 |
| 2016 | $805 | $68,365 | $0 | $0 |
| 2015 | $738 | $61,930 | $0 | $0 |
| 2014 | $686 | $57,750 | $0 | $0 |
Source: Public Records
Map
Nearby Homes