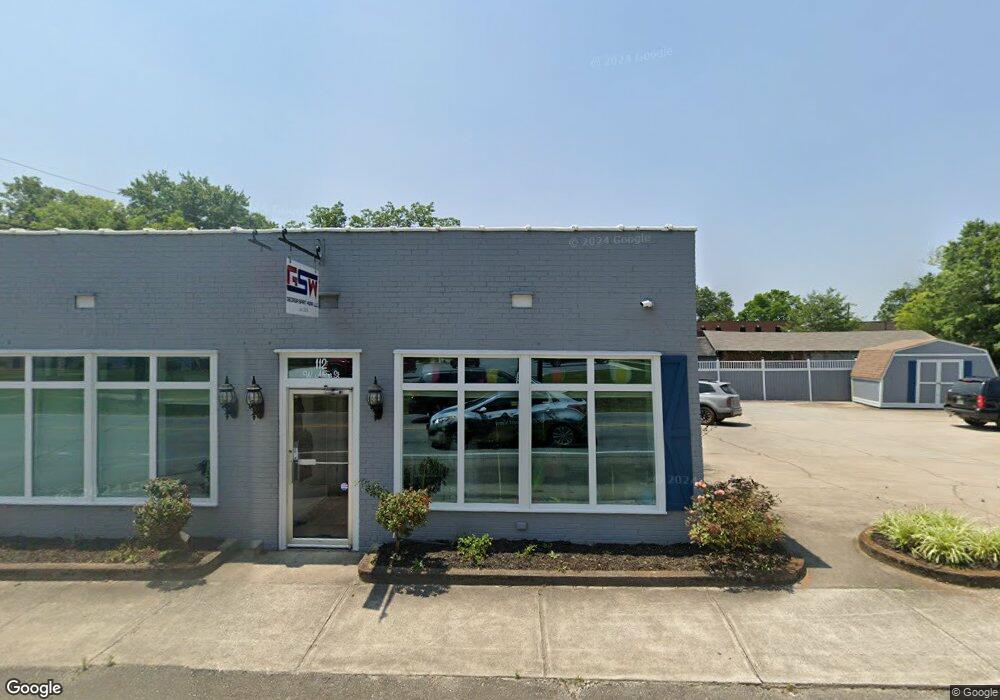
112 W Athens St Winder, GA 30680
Estimated Value: $239,046
--
Bed
--
Bath
1,320
Sq Ft
$181/Sq Ft
Est. Value
About This Home
This home is located at 112 W Athens St, Winder, GA 30680 and is currently estimated at $239,046, approximately $181 per square foot. 112 W Athens St is a home located in Barrow County with nearby schools including County Line Elementary School, Russell Middle School, and Winder-Barrow High School.
Ownership History
Date
Name
Owned For
Owner Type
Purchase Details
Closed on
Aug 23, 2023
Sold by
Hawkins Keven W
Bought by
Hawkins Angela C and Hawkins Keven W
Current Estimated Value
Purchase Details
Closed on
Jan 29, 2021
Sold by
Irvine Charles R
Bought by
Hawkins Keven W
Purchase Details
Closed on
Oct 1, 2013
Sold by
Gregory Remedios O
Bought by
Irvine Charles
Purchase Details
Closed on
Nov 22, 2005
Sold by
Hump Mill Lending Inc
Bought by
Mcdaniel W Joe and Mcdaniel Jason
Home Financials for this Owner
Home Financials are based on the most recent Mortgage that was taken out on this home.
Original Mortgage
$146,979
Interest Rate
6%
Mortgage Type
New Conventional
Purchase Details
Closed on
Jan 31, 2005
Sold by
Biscoe Hubert A
Bought by
Hump-Mill Hauling Inc
Create a Home Valuation Report for This Property
The Home Valuation Report is an in-depth analysis detailing your home's value as well as a comparison with similar homes in the area
Home Values in the Area
Average Home Value in this Area
Purchase History
| Date | Buyer | Sale Price | Title Company |
|---|---|---|---|
| Hawkins Angela C | -- | -- | |
| Hawkins Keven W | $157,500 | -- | |
| Irvine Charles | -- | -- | |
| Mcdaniel W Joe | $170,000 | -- | |
| Hump-Mill Hauling Inc | $160,000 | -- |
Source: Public Records
Mortgage History
| Date | Status | Borrower | Loan Amount |
|---|---|---|---|
| Previous Owner | Mcdaniel W Joe | $146,979 |
Source: Public Records
Tax History Compared to Growth
Tax History
| Year | Tax Paid | Tax Assessment Tax Assessment Total Assessment is a certain percentage of the fair market value that is determined by local assessors to be the total taxable value of land and additions on the property. | Land | Improvement |
|---|---|---|---|---|
| 2024 | $2,119 | $74,747 | $8,960 | $65,787 |
| 2023 | $2,481 | $74,747 | $8,960 | $65,787 |
| 2022 | $2,131 | $74,786 | $8,960 | $65,826 |
| 2021 | $2,137 | $59,352 | $24,000 | $35,352 |
| 2020 | $2,048 | $59,352 | $24,000 | $35,352 |
| 2019 | $2,076 | $59,352 | $24,000 | $35,352 |
| 2018 | $2,078 | $59,548 | $24,000 | $35,548 |
| 2017 | $1,657 | $55,523 | $24,000 | $31,523 |
| 2016 | $1,757 | $51,657 | $24,000 | $27,657 |
| 2015 | $1,759 | $51,657 | $24,000 | $27,657 |
| 2014 | $1,417 | $41,097 | $13,440 | $27,657 |
| 2013 | -- | $38,305 | $11,760 | $26,545 |
Source: Public Records
Map
Nearby Homes
- 0 W Athens St Unit 10544465
- 92 Woodlawn Ave
- 0 Georgia Highway 211 Unit 7483562
- 102 N Center St
- 217 Bellview St
- 253 3rd Ave
- 116 N Broad St
- 21 Duke Cir
- 256 4th Ave
- 42 Horton St
- 0 Jerome St Unit 10359679
- 15 E New St
- 132 Circle Dr
- 98 Circle Dr
- 19 Holland Cove
- 171 Brookview Terrace
- 18 E New St
- 122 Capitol Ave
- 17 W Wright St
- 88 E Stephens St
- 0 Athens St Hwy 211 NW Unit 3276498
- 27 Beulah St
- 102 W Athens St Unit 1
- 102 W Athens St Unit 102
- 122 NW W Athens St Unit B
- 122 W Athens St
- 122 W Athens St
- 122 W Athens St
- 70 Church St
- 74 Church St
- 85 Church St
- 68 Betts St
- 59 W May St Unit 38
- 44 N Center St
- 85 S Center St
- 0 Porter St Unit 7012569
- 0 Porter St Unit 5328360
- 90 Church St
- 70 Betts St
- 88 W Candler St