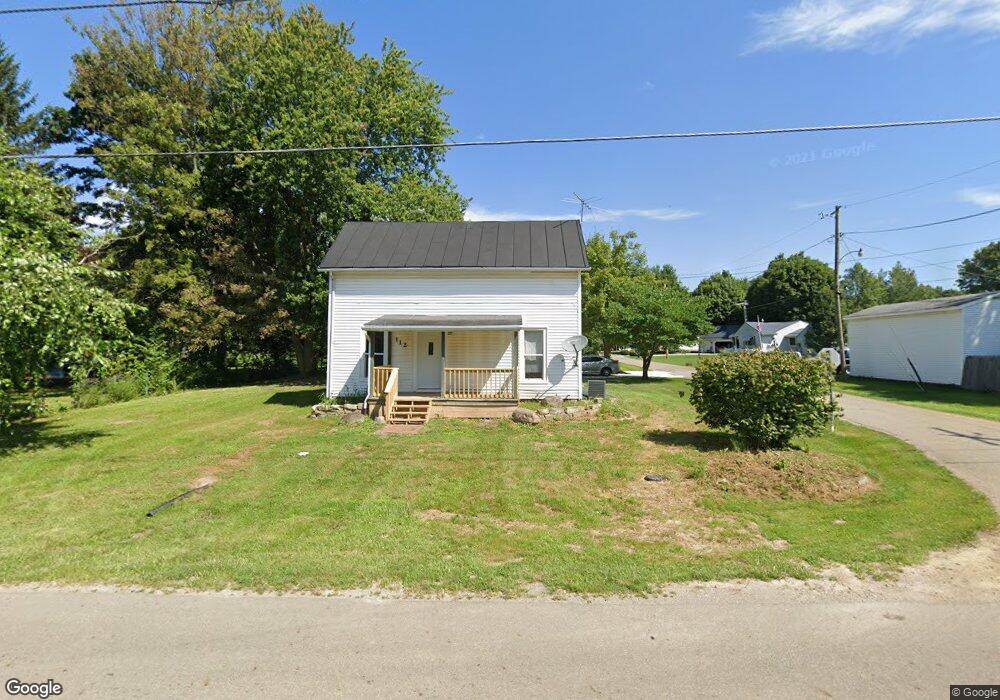
112 W Main St Fulton, OH 43321
Estimated Value: $152,000 - $183,000
3
Beds
1
Bath
1,106
Sq Ft
$149/Sq Ft
Est. Value
About This Home
This home is located at 112 W Main St, Fulton, OH 43321 and is currently estimated at $165,000, approximately $149 per square foot. 112 W Main St is a home located in Morrow County with nearby schools including Cardington-Lincoln Elementary School, Cardington Intermediate School, and Cardington-Lincoln High School.
Ownership History
Date
Name
Owned For
Owner Type
Purchase Details
Closed on
May 7, 2021
Sold by
Seagle Mark
Bought by
Hass Timothy B
Current Estimated Value
Purchase Details
Closed on
Nov 7, 2016
Sold by
Seagel Mark
Bought by
Mark Seagle
Home Financials for this Owner
Home Financials are based on the most recent Mortgage that was taken out on this home.
Interest Rate
3.54%
Purchase Details
Closed on
Oct 25, 2016
Sold by
Flot Carter L
Bought by
Mark Seagel
Home Financials for this Owner
Home Financials are based on the most recent Mortgage that was taken out on this home.
Interest Rate
3.54%
Purchase Details
Closed on
Mar 18, 2003
Sold by
Gandee Larry M and Gandee Alisa D
Bought by
Flot Carter L
Purchase Details
Closed on
Sep 29, 2000
Sold by
Young Kenneth and Gandee Alisa D
Bought by
Gandee Larry M and Gandee Alisa D
Purchase Details
Closed on
Jun 5, 1997
Sold by
Jackson Von D And
Bought by
Young Kenneth
Create a Home Valuation Report for This Property
The Home Valuation Report is an in-depth analysis detailing your home's value as well as a comparison with similar homes in the area
Home Values in the Area
Average Home Value in this Area
Purchase History
| Date | Buyer | Sale Price | Title Company |
|---|---|---|---|
| Hass Timothy B | $80,000 | None Available | |
| Mark Seagle | -- | -- | |
| Mark Seagel | $60,000 | -- | |
| Flot Carter L | $72,000 | -- | |
| Gandee Larry M | -- | -- | |
| Young Kenneth | $18,500 | -- |
Source: Public Records
Mortgage History
| Date | Status | Borrower | Loan Amount |
|---|---|---|---|
| Previous Owner | Mark Seagel | -- | |
| Previous Owner | Mark Seagel | -- |
Source: Public Records
Tax History Compared to Growth
Tax History
| Year | Tax Paid | Tax Assessment Tax Assessment Total Assessment is a certain percentage of the fair market value that is determined by local assessors to be the total taxable value of land and additions on the property. | Land | Improvement |
|---|---|---|---|---|
| 2024 | $1,152 | $26,190 | $3,050 | $23,140 |
| 2023 | $1,152 | $26,190 | $3,050 | $23,140 |
| 2022 | $1,143 | $23,600 | $3,610 | $19,990 |
| 2021 | $1,133 | $23,600 | $3,610 | $19,990 |
| 2020 | $1,121 | $23,600 | $3,610 | $19,990 |
| 2019 | $990 | $19,990 | $3,050 | $16,940 |
| 2018 | $987 | $19,990 | $3,050 | $16,940 |
| 2017 | $959 | $19,990 | $3,050 | $16,940 |
| 2016 | $1,053 | $21,840 | $2,590 | $19,250 |
| 2015 | $919 | $21,840 | $2,590 | $19,250 |
| 2014 | $936 | $21,840 | $2,590 | $19,250 |
| 2013 | $996 | $23,000 | $2,730 | $20,270 |
Source: Public Records
Map
Nearby Homes
- 3620 County Road 25
- 001 State Route 61
- 0 State Route 61
- 3310 State Route 61
- Lot 1 County Road 25
- Lot 2 County Road 25
- Lot 3 County Road 25
- 0 County Road 25
- 2504 County Road 26
- 2844 County Road 169
- 2979 County Road 170
- 2919 Township Road 155
- 0 County Road 25 Unit 20850665
- 0004 County Road 26
- 0003 County Road 26
- 0002 County Road 26
- 2511 Township Road 20
- Lot 0 Chesterville Ave
- 221 Nichols St
- 5344 County Road 25