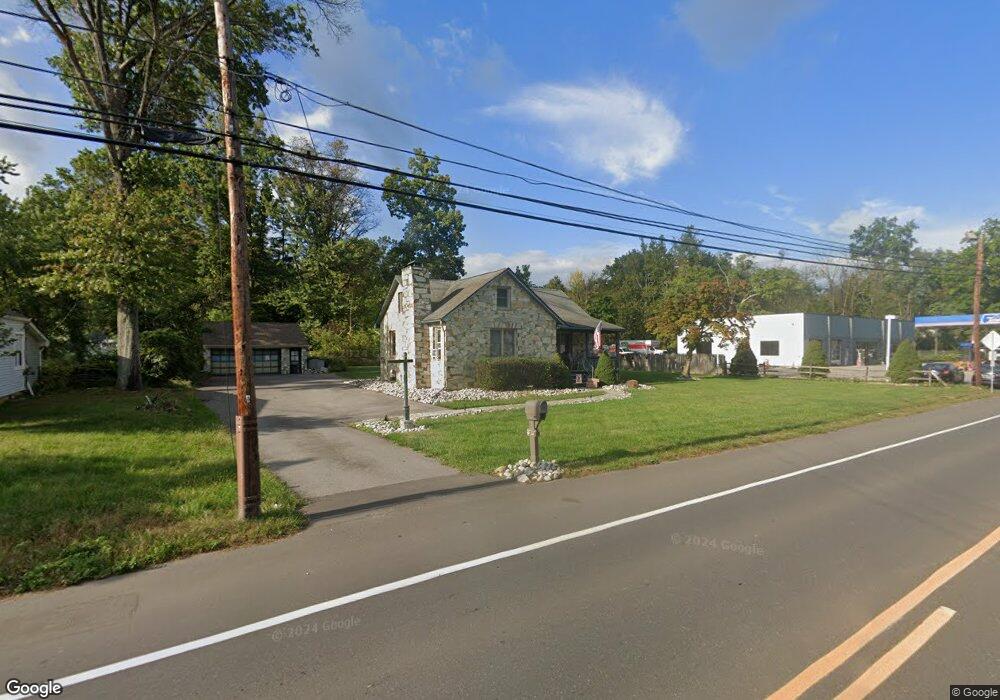
112 W Main St High Bridge, NJ 08829
Estimated Value: $416,733 - $452,000
Studio
--
Bath
1,587
Sq Ft
$274/Sq Ft
Est. Value
About This Home
This home is located at 112 W Main St, High Bridge, NJ 08829 and is currently estimated at $434,433, approximately $273 per square foot. 112 W Main St is a home located in Hunterdon County with nearby schools including High Bridge Elementary School, High Bridge Middle School, and Voorhees High School.
Ownership History
Date
Name
Owned For
Owner Type
Purchase Details
Closed on
Jun 5, 2012
Sold by
Sova Holly Ann and Kraska Holly
Bought by
Sova Daniel
Current Estimated Value
Home Financials for this Owner
Home Financials are based on the most recent Mortgage that was taken out on this home.
Original Mortgage
$250,234
Outstanding Balance
$173,584
Interest Rate
3.85%
Mortgage Type
New Conventional
Estimated Equity
$260,849
Purchase Details
Closed on
Oct 31, 2007
Sold by
Kmit George N
Bought by
Kraska Holly and Sova Daniel
Home Financials for this Owner
Home Financials are based on the most recent Mortgage that was taken out on this home.
Original Mortgage
$265,000
Interest Rate
6.47%
Mortgage Type
Purchase Money Mortgage
Purchase Details
Closed on
Apr 1, 1992
Sold by
Kmit George and Kmit Patricia
Bought by
Kmit George N
Purchase Details
Closed on
Aug 24, 1990
Sold by
Smith Edna M
Bought by
Kmit George and Kmit Patricia
Create a Home Valuation Report for This Property
The Home Valuation Report is an in-depth analysis detailing your home's value as well as a comparison with similar homes in the area
Home Values in the Area
Average Home Value in this Area
Purchase History
| Date | Buyer | Sale Price | Title Company |
|---|---|---|---|
| Sova Daniel | -- | Fidelity National Title Ins | |
| Kraska Holly | $265,000 | None Available | |
| Kmit George N | -- | -- | |
| Kmit George | $119,400 | -- |
Source: Public Records
Mortgage History
| Date | Status | Borrower | Loan Amount |
|---|---|---|---|
| Open | Sova Daniel | $250,234 | |
| Previous Owner | Kraska Holly | $265,000 |
Source: Public Records
Tax History
| Year | Tax Paid | Tax Assessment Tax Assessment Total Assessment is a certain percentage of the fair market value that is determined by local assessors to be the total taxable value of land and additions on the property. | Land | Improvement |
|---|---|---|---|---|
| 2025 | $9,404 | $339,100 | $116,200 | $222,900 |
| 2024 | $8,541 | $288,100 | $59,700 | $228,400 |
Source: Public Records
Map
Nearby Homes
Your Personal Tour Guide
Ask me questions while you tour the home.