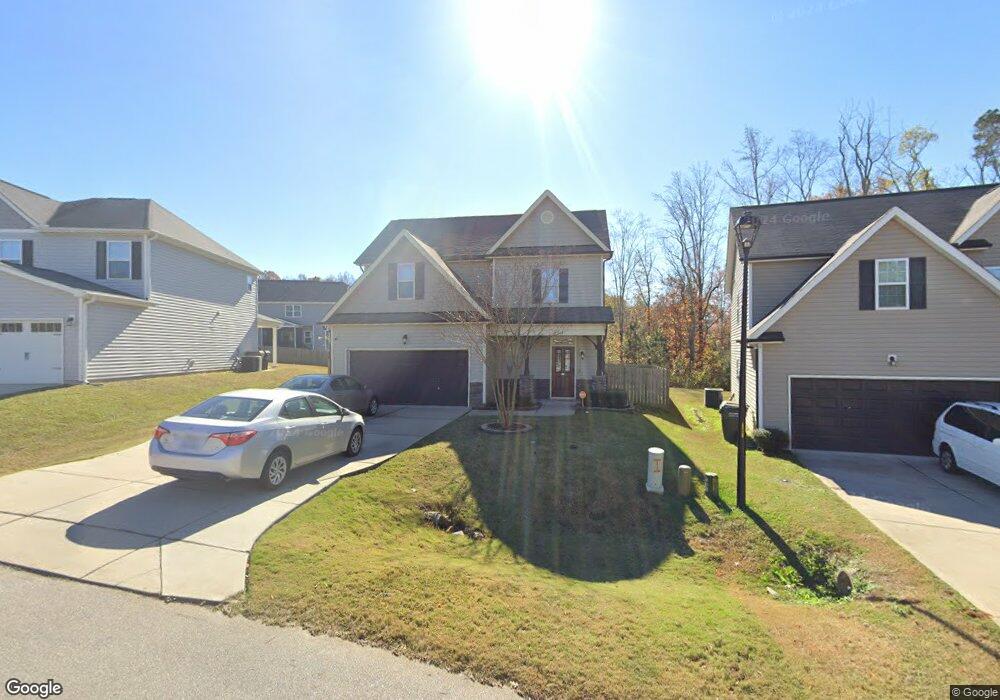
112 W Webber Ln Clayton, NC 27527
Estimated Value: $329,455 - $362,000
3
Beds
3
Baths
1,786
Sq Ft
$192/Sq Ft
Est. Value
About This Home
This home is located at 112 W Webber Ln, Clayton, NC 27527 and is currently estimated at $343,114, approximately $192 per square foot. 112 W Webber Ln is a home located in Johnston County with nearby schools including Riverwood Elementary School, Riverwood Middle School, and Corinth Holders High School.
Ownership History
Date
Name
Owned For
Owner Type
Purchase Details
Closed on
Jan 26, 2021
Sold by
Soto Marcos Antonio and Soto Betsabel
Bought by
Thomas Sebastian and Sebastian Priyadarshiri
Current Estimated Value
Home Financials for this Owner
Home Financials are based on the most recent Mortgage that was taken out on this home.
Original Mortgage
$257,050
Outstanding Balance
$229,784
Interest Rate
2.67%
Mortgage Type
New Conventional
Estimated Equity
$113,330
Purchase Details
Closed on
Sep 1, 2017
Sold by
Sapp Clayton R and Sapp Kayla C
Bought by
Galvan Betsabel and Soto Marcos Antonio
Purchase Details
Closed on
May 15, 2015
Sold by
Sapp Clayton R
Bought by
Rms Investments Llc
Home Financials for this Owner
Home Financials are based on the most recent Mortgage that was taken out on this home.
Original Mortgage
$185,250
Interest Rate
3.8%
Mortgage Type
New Conventional
Create a Home Valuation Report for This Property
The Home Valuation Report is an in-depth analysis detailing your home's value as well as a comparison with similar homes in the area
Home Values in the Area
Average Home Value in this Area
Purchase History
| Date | Buyer | Sale Price | Title Company |
|---|---|---|---|
| Thomas Sebastian | $265,000 | None Listed On Document | |
| Galvan Betsabel | $210,000 | None Available | |
| Rms Investments Llc | $195,000 | -- | |
| Sapp Clayton R | $195,000 | None Available |
Source: Public Records
Mortgage History
| Date | Status | Borrower | Loan Amount |
|---|---|---|---|
| Open | Thomas Sebastian | $257,050 | |
| Previous Owner | Sapp Clayton R | $185,250 |
Source: Public Records
Tax History
| Year | Tax Paid | Tax Assessment Tax Assessment Total Assessment is a certain percentage of the fair market value that is determined by local assessors to be the total taxable value of land and additions on the property. | Land | Improvement |
|---|---|---|---|---|
| 2025 | $3,303 | $327,040 | $85,000 | $242,040 |
| 2024 | $2,632 | $199,400 | $42,000 | $157,400 |
| 2023 | $2,572 | $199,400 | $42,000 | $157,400 |
| 2022 | $2,652 | $199,400 | $42,000 | $157,400 |
| 2021 | $2,612 | $199,400 | $42,000 | $157,400 |
| 2020 | $2,787 | $199,400 | $42,000 | $157,400 |
| 2019 | $2,803 | $199,400 | $42,000 | $157,400 |
| 2018 | $2,332 | $169,550 | $40,000 | $129,550 |
| 2017 | $2,255 | $169,550 | $40,000 | $129,550 |
| 2016 | $2,255 | $169,550 | $40,000 | $129,550 |
| 2015 | $532 | $40,000 | $40,000 | $0 |
Source: Public Records
Map
Nearby Homes
- 156 Haywood Ln
- 133 Haywood Ln
- 305 E Webber Ln
- 308 Chamberlain Dr
- 1008 Sarazen Dr
- 296 Stansbury Ln
- 400 Charleston Dr
- 524 Woodson Dr
- 629 Woodson Dr
- 117 Landry Ct
- 113 Alan Ln
- 43 Papillion Way
- 114 Cinnabar St
- 117 Cinnabar St
- 24 N Brookhollow Way
- 125 Cinnabar St
- 121 Cinnabar St
- 402 Bluejay St
- 110 Cinnabar St
- 394 Bluejay St
- 112 W Webber Ln
- 108 W Webber Ln
- 108 W Webber Ln
- 116 W Webber Ln
- 116 W Webber Ln
- 228 W Webber Ln
- 104 W Webber Ln
- 104 W Webber Ln
- 120 W Webber Ln
- 109 W Webber Ln
- 113 Sloan Dr
- 100 W Webber Ln
- 100 W Webber Ln
- 124 W Webber Ln
- 113 W Webber Ln
- 113 W Webber Ln
- 137 Bobby Ray Ct
- 117 W Webber Ln
- 109 Sloan Dr
- 133 Bobby Ray Ct
Your Personal Tour Guide
Ask me questions while you tour the home.