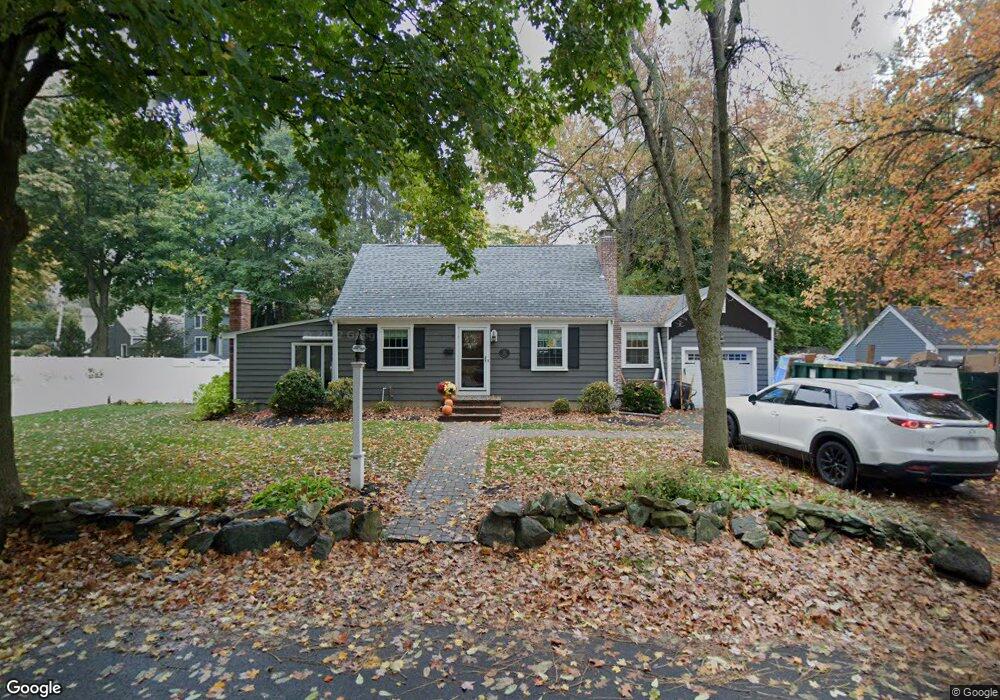
112 Walnut St Reading, MA 01867
Estimated Value: $770,000 - $890,000
3
Beds
2
Baths
1,592
Sq Ft
$525/Sq Ft
Est. Value
About This Home
This home is located at 112 Walnut St, Reading, MA 01867 and is currently estimated at $835,468, approximately $524 per square foot. 112 Walnut St is a home located in Middlesex County with nearby schools including Joshua Eaton Elementary School, Walter S. Parker Middle School, and Reading Memorial High School.
Ownership History
Date
Name
Owned For
Owner Type
Purchase Details
Closed on
Nov 22, 2011
Sold by
Noonan Ryan T and Noonan Heather E
Bought by
Kerr Andrew J and Kerr Shannon R
Current Estimated Value
Home Financials for this Owner
Home Financials are based on the most recent Mortgage that was taken out on this home.
Original Mortgage
$337,450
Outstanding Balance
$228,994
Interest Rate
3.92%
Mortgage Type
Purchase Money Mortgage
Estimated Equity
$606,474
Purchase Details
Closed on
Feb 28, 2007
Sold by
Ines Rupert M and Ines Susan E
Bought by
Noonan Heather E and Noonan Ryan T
Home Financials for this Owner
Home Financials are based on the most recent Mortgage that was taken out on this home.
Original Mortgage
$304,000
Interest Rate
6.27%
Mortgage Type
Purchase Money Mortgage
Create a Home Valuation Report for This Property
The Home Valuation Report is an in-depth analysis detailing your home's value as well as a comparison with similar homes in the area
Home Values in the Area
Average Home Value in this Area
Purchase History
| Date | Buyer | Sale Price | Title Company |
|---|---|---|---|
| Kerr Andrew J | $397,000 | -- | |
| Noonan Heather E | $380,000 | -- |
Source: Public Records
Mortgage History
| Date | Status | Borrower | Loan Amount |
|---|---|---|---|
| Open | Kerr Andrew J | $337,450 | |
| Previous Owner | Noonan Heather E | $304,000 |
Source: Public Records
Tax History
| Year | Tax Paid | Tax Assessment Tax Assessment Total Assessment is a certain percentage of the fair market value that is determined by local assessors to be the total taxable value of land and additions on the property. | Land | Improvement |
|---|---|---|---|---|
| 2025 | $8,908 | $782,100 | $481,900 | $300,200 |
| 2024 | $8,806 | $751,400 | $463,000 | $288,400 |
| 2023 | $8,528 | $677,400 | $417,400 | $260,000 |
| 2022 | $8,251 | $619,000 | $379,500 | $239,500 |
| 2021 | $7,162 | $581,900 | $363,600 | $218,300 |
| 2020 | $7,726 | $553,800 | $346,000 | $207,800 |
| 2019 | $7,465 | $524,600 | $329,600 | $195,000 |
| 2018 | $17,218 | $494,700 | $310,800 | $183,900 |
| 2017 | $6,548 | $466,700 | $293,200 | $173,500 |
| 2016 | $6,526 | $450,100 | $293,700 | $156,400 |
| 2015 | $5,942 | $404,200 | $271,400 | $132,800 |
| 2014 | $5,757 | $390,600 | $262,200 | $128,400 |
Source: Public Records
Map
Nearby Homes
- 133 Pine Ridge Rd
- 313 South St
- 246 Walnut St
- 20 Pinevale Ave
- 241 Main St Unit C3
- 103 Oak St
- 75 Whitehall Ln
- 403 Gazebo Cir
- 1 Summit Dr Unit 57
- 2 Summit Dr Unit 43
- 1 Garvey Rd Unit 1
- 100 Prescott St
- 80 Redfield Rd
- 68 Main St Unit 21C
- 12 Isola Ln
- 66 Main St Unit 15A
- 98 Main St Unit 2
- 5 Washington St Unit D4
- 69 Ash St
- 101 King St Unit 101
Your Personal Tour Guide
Ask me questions while you tour the home.