Estimated Value: $103,000 - $172,000
--
Bed
--
Bath
1,464
Sq Ft
$93/Sq Ft
Est. Value
About This Home
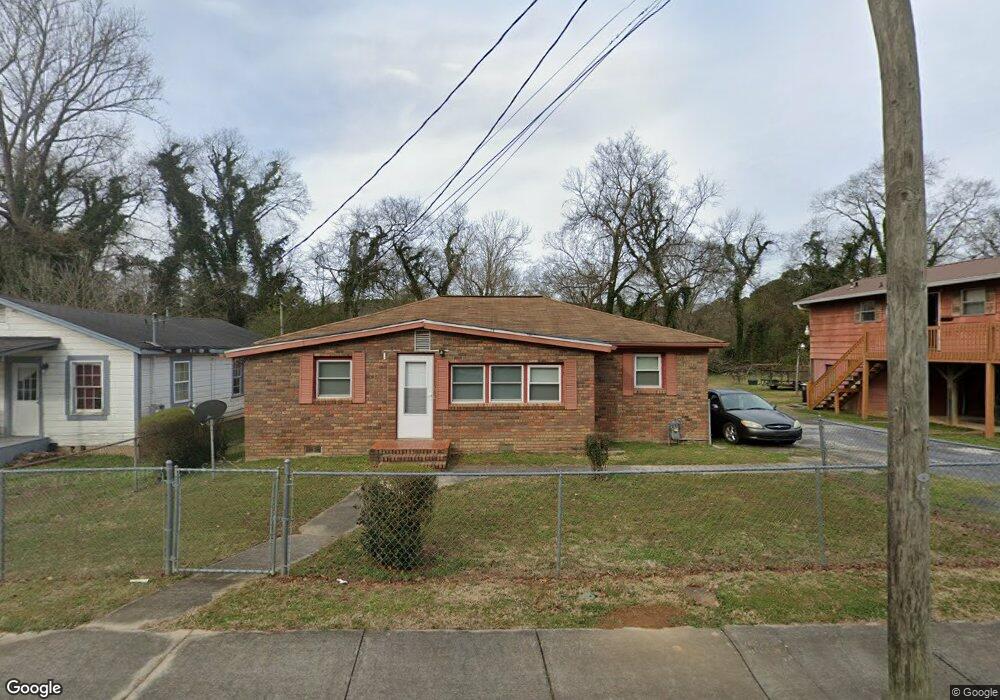
This home is located at 112 Wilson Ave SW, Rome, GA 30161 and is currently estimated at $136,521, approximately $93 per square foot. 112 Wilson Ave SW is a home located in Floyd County with nearby schools including Dan McCarty Middle School, Rome High School, and Darlington School.
Ownership History
Date
Name
Owned For
Owner Type
Purchase Details
Closed on
Apr 26, 2013
Sold by
Braziel Darlene
Bought by
P and R
Current Estimated Value
Purchase Details
Closed on
May 23, 1997
Bought by
P and R
Purchase Details
Closed on
Dec 19, 1990
Sold by
Braziel George E and Braziel Darlin
Bought by
Braziel Darlene
Purchase Details
Closed on
Oct 24, 1989
Sold by
Braziel Mary M and Braziel Bobby
Bought by
Braziel George E and Braziel Darlin
Purchase Details
Closed on
Aug 11, 1989
Sold by
Braziel George E
Bought by
Braziel Mary M and Braziel Bobby
Purchase Details
Closed on
Jul 8, 1980
Sold by
Braziel David
Bought by
Braziel George E
Purchase Details
Closed on
May 2, 1978
Bought by
P and R
Purchase Details
Closed on
May 1, 1978
Sold by
Brazil David and Brazil Mary
Bought by
Braziel David
Purchase Details
Closed on
Mar 31, 1961
Bought by
P and R
Purchase Details
Closed on
Feb 14, 1961
Bought by
Brazil David and Brazil Mary
Create a Home Valuation Report for This Property
The Home Valuation Report is an in-depth analysis detailing your home's value as well as a comparison with similar homes in the area
Home Values in the Area
Average Home Value in this Area
Purchase History
| Date | Buyer | Sale Price | Title Company |
|---|---|---|---|
| P | -- | -- | |
| P | -- | -- | |
| Braziel Darlene | -- | -- | |
| Braziel George E | $30,000 | -- | |
| Braziel Mary M | -- | -- | |
| Braziel George E | -- | -- | |
| P | -- | -- | |
| Braziel David | -- | -- | |
| P | -- | -- | |
| Brazil David | -- | -- |
Source: Public Records
Tax History Compared to Growth
Tax History
| Year | Tax Paid | Tax Assessment Tax Assessment Total Assessment is a certain percentage of the fair market value that is determined by local assessors to be the total taxable value of land and additions on the property. | Land | Improvement |
|---|---|---|---|---|
| 2024 | $506 | $44,980 | $5,280 | $39,700 |
| 2023 | $453 | $42,675 | $4,800 | $37,875 |
| 2022 | $429 | $28,524 | $3,840 | $24,684 |
| 2021 | $438 | $25,575 | $3,840 | $21,735 |
| 2020 | $415 | $23,261 | $3,000 | $20,261 |
| 2019 | $378 | $21,766 | $3,000 | $18,766 |
| 2018 | $350 | $20,291 | $3,000 | $17,291 |
| 2017 | $332 | $19,402 | $3,000 | $16,402 |
| 2016 | $322 | $18,800 | $3,000 | $15,800 |
| 2015 | $284 | $18,800 | $3,000 | $15,800 |
| 2014 | $284 | $18,800 | $3,000 | $15,800 |
Source: Public Records
Map
Nearby Homes
- 218 Wilson Ave SW
- 101 Hardy Ave SW
- 204 Myrtle St SW
- 334 Branham Ave SW
- 410 Hardy Ave SW
- 110 Cherokee St SW
- 105 Mary St SW
- 3 Grover St SW
- 107 Butler St SW
- 232 S Broad St SW
- 18 Butler St SW
- 3 Porter St SW
- 515 Harper Ave SW
- 529 Branham Ave SW
- 515 S Broad St SW
- 6 Horseleg Creek Rd SW
- 115 Lookout Cir SW
- 113 Lookout Cir SW
- 111 Lookout Cir SW
- 114 Wilson Ave SW
- 110 Wilson Ave SW
- 116 Wilson Ave SW
- 108 Wilson Ave SW
- 106 Wilson Ave SW
- 106 Charles St SW
- 200 Wilson Ave SW
- 111 Wilson Ave SW
- 104 Wilson Ave SW
- 107 Wilson Ave SW
- 202 Wilson Ave SW
- 104 Charles St SW
- 105 Wilson Ave SW
- 102 Wilson Ave SW
- 103 Wilson Ave SW
- 204 Wilson Ave SW
- 201 Wilson Ave SW
- 100 Wilson Ave SW
- 206 Wilson Ave SW Unit 218
- 206 Wilson Ave SW